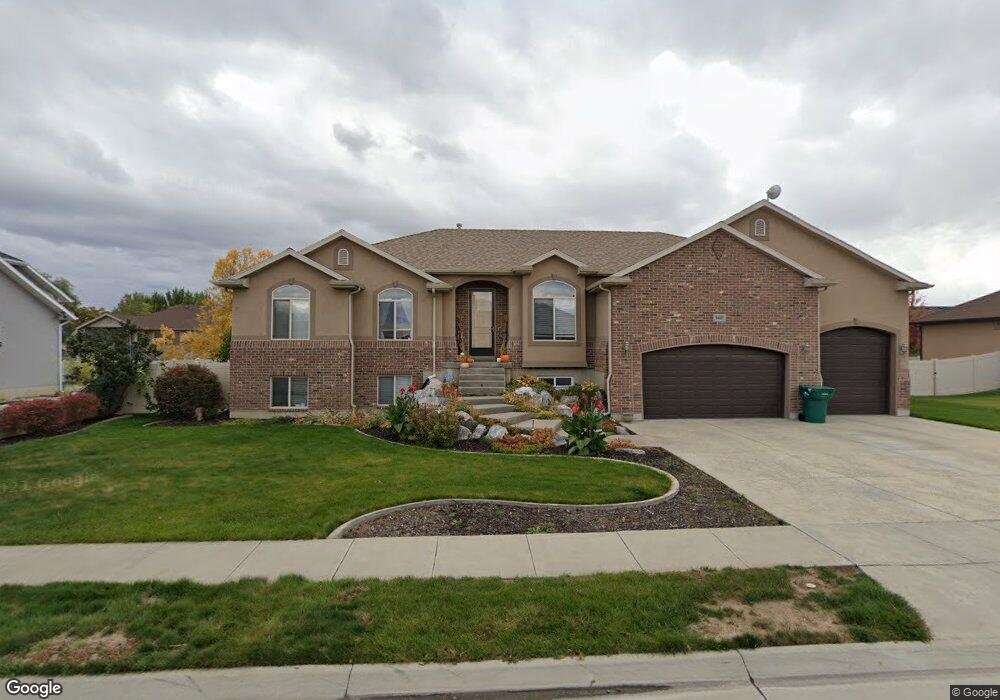
2457 W 1725 S West Haven, UT 84401
Estimated Value: $582,806 - $601,000
3
Beds
2
Baths
3,564
Sq Ft
$166/Sq Ft
Est. Value
About This Home
This home is located at 2457 W 1725 S, West Haven, UT 84401 and is currently estimated at $592,702, approximately $166 per square foot. 2457 W 1725 S is a home located in Weber County with nearby schools including West Weber School, Wahlquist Junior High School, and Fremont High School.
Ownership History
Date
Name
Owned For
Owner Type
Purchase Details
Closed on
Nov 22, 2021
Sold by
Eileen Deelstra
Bought by
Eileen M Deelstra Family Trust
Current Estimated Value
Purchase Details
Closed on
Jan 11, 2008
Sold by
Probuilt Enterprises Llc
Bought by
Deelstra Ted and Deelstra Eileen
Home Financials for this Owner
Home Financials are based on the most recent Mortgage that was taken out on this home.
Original Mortgage
$276,000
Interest Rate
5.96%
Mortgage Type
Purchase Money Mortgage
Purchase Details
Closed on
Jun 21, 2006
Sold by
Northern Developers Llc
Bought by
Probuilt Enterprises Llc
Home Financials for this Owner
Home Financials are based on the most recent Mortgage that was taken out on this home.
Original Mortgage
$209,592
Interest Rate
6.55%
Mortgage Type
Purchase Money Mortgage
Create a Home Valuation Report for This Property
The Home Valuation Report is an in-depth analysis detailing your home's value as well as a comparison with similar homes in the area
Home Values in the Area
Average Home Value in this Area
Purchase History
| Date | Buyer | Sale Price | Title Company |
|---|---|---|---|
| Eileen M Deelstra Family Trust | -- | Walter C Bornemeier Pllc | |
| Deelstra Ted | -- | Mountain View Title Ogden | |
| Probuilt Enterprises Llc | -- | Heritage West |
Source: Public Records
Mortgage History
| Date | Status | Borrower | Loan Amount |
|---|---|---|---|
| Previous Owner | Deelstra Ted | $276,000 | |
| Previous Owner | Probuilt Enterprises Llc | $209,592 |
Source: Public Records
Tax History Compared to Growth
Tax History
| Year | Tax Paid | Tax Assessment Tax Assessment Total Assessment is a certain percentage of the fair market value that is determined by local assessors to be the total taxable value of land and additions on the property. | Land | Improvement |
|---|---|---|---|---|
| 2025 | $3,515 | $580,947 | $173,123 | $407,824 |
| 2024 | $3,362 | $314,049 | $95,217 | $218,832 |
| 2023 | $3,273 | $305,800 | $95,299 | $210,501 |
| 2022 | $3,059 | $292,050 | $95,299 | $196,751 |
| 2021 | $2,691 | $432,000 | $93,429 | $338,571 |
| 2020 | $2,510 | $368,000 | $78,537 | $289,463 |
| 2019 | $2,460 | $341,000 | $78,862 | $262,138 |
| 2018 | $2,331 | $308,000 | $64,821 | $243,179 |
| 2017 | $2,201 | $282,000 | $65,148 | $216,852 |
| 2016 | $2,170 | $150,572 | $35,938 | $114,634 |
| 2015 | $2,175 | $150,571 | $35,938 | $114,633 |
| 2014 | $2,027 | $136,493 | $35,938 | $100,555 |
Source: Public Records
Map
Nearby Homes
- 2504 W 1725 S
- 2454 W 1775 S
- 2611 W 1850 S
- 1656 S Prevedel Dr
- 1882 S 2475 W
- 2300 Farmhouse Select Plan at Fairhaven
- 1856 S 2425 W
- 1918 S 2475 W
- 1903 S 2425 W
- 1977 S 2425 W
- 2067 S 2425 W
- 2050 Farmhouse Select Plan at Fairhaven
- 1953 S 2425 W
- 1869 S 2425 W
- 1944 S 2425 W
- 3000 Farmhouse Select Plan at Fairhaven
- 1583 S Williams Dr
- 1694 S Hayfield Dr
- 2176 W 1735 S
- 2080 W 1755 Ct S