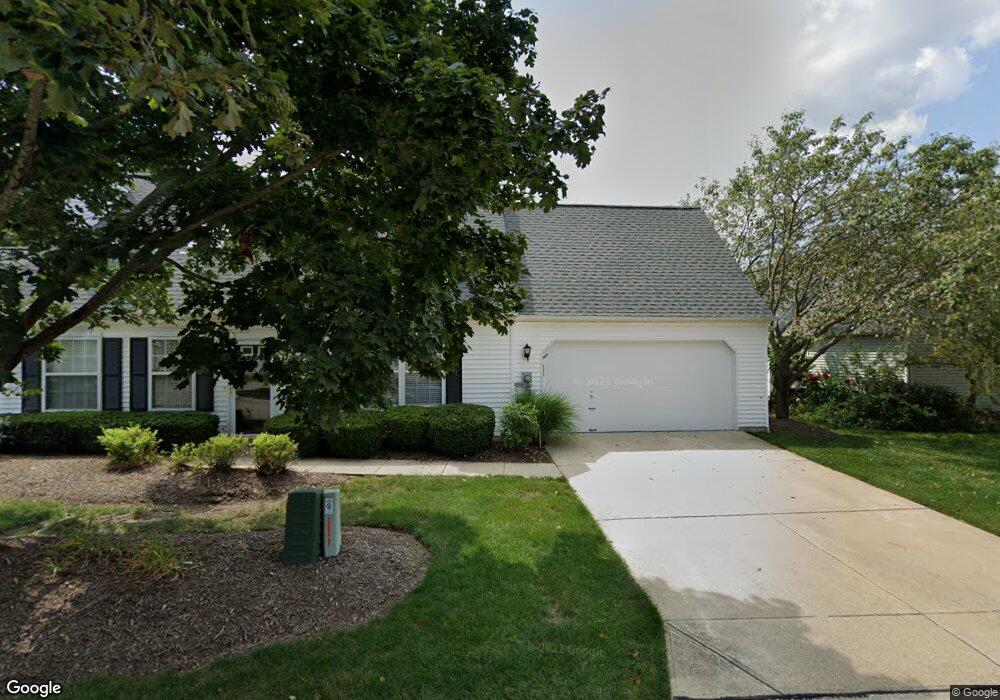
24575 Grove Pond Way Unit S47 Olmsted Falls, OH 44138
Estimated Value: $229,069 - $258,000
2
Beds
2
Baths
1,326
Sq Ft
$183/Sq Ft
Est. Value
About This Home
This home is located at 24575 Grove Pond Way Unit S47, Olmsted Falls, OH 44138 and is currently estimated at $243,267, approximately $183 per square foot. 24575 Grove Pond Way Unit S47 is a home located in Cuyahoga County with nearby schools including Falls-Lenox Primary Elementary School, Olmsted Falls Intermediate Building, and Olmsted Falls Middle School.
Ownership History
Date
Name
Owned For
Owner Type
Purchase Details
Closed on
Jun 25, 2003
Sold by
Tucker Julie Ann
Bought by
Modock Dennis P
Current Estimated Value
Home Financials for this Owner
Home Financials are based on the most recent Mortgage that was taken out on this home.
Original Mortgage
$127,500
Outstanding Balance
$55,227
Interest Rate
5.51%
Mortgage Type
Unknown
Estimated Equity
$188,040
Purchase Details
Closed on
Sep 26, 2000
Sold by
Steven Leidich and Steven Dana
Bought by
Tucker Julie Ann
Home Financials for this Owner
Home Financials are based on the most recent Mortgage that was taken out on this home.
Original Mortgage
$133,000
Interest Rate
7.98%
Purchase Details
Closed on
Nov 28, 1997
Sold by
Whitlatch & Co
Bought by
Leidich Dana M and Leidich Steven D
Home Financials for this Owner
Home Financials are based on the most recent Mortgage that was taken out on this home.
Original Mortgage
$121,800
Interest Rate
7.45%
Mortgage Type
New Conventional
Create a Home Valuation Report for This Property
The Home Valuation Report is an in-depth analysis detailing your home's value as well as a comparison with similar homes in the area
Home Values in the Area
Average Home Value in this Area
Purchase History
| Date | Buyer | Sale Price | Title Company |
|---|---|---|---|
| Modock Dennis P | $152,500 | Real Living Title Agency Ltd | |
| Tucker Julie Ann | $140,000 | Insignia Title Agency Ltd | |
| Leidich Dana M | $128,242 | -- |
Source: Public Records
Mortgage History
| Date | Status | Borrower | Loan Amount |
|---|---|---|---|
| Open | Modock Dennis P | $127,500 | |
| Previous Owner | Tucker Julie Ann | $133,000 | |
| Previous Owner | Leidich Dana M | $121,800 |
Source: Public Records
Tax History Compared to Growth
Tax History
| Year | Tax Paid | Tax Assessment Tax Assessment Total Assessment is a certain percentage of the fair market value that is determined by local assessors to be the total taxable value of land and additions on the property. | Land | Improvement |
|---|---|---|---|---|
| 2024 | $3,936 | $69,265 | $7,000 | $62,265 |
| 2023 | $3,729 | $55,370 | $5,530 | $49,840 |
| 2022 | $3,727 | $55,370 | $5,530 | $49,840 |
| 2021 | $3,689 | $55,370 | $5,530 | $49,840 |
| 2020 | $3,383 | $46,550 | $4,660 | $41,900 |
| 2019 | $3,002 | $133,000 | $13,300 | $119,700 |
| 2018 | $2,849 | $46,550 | $4,660 | $41,900 |
| 2017 | $2,684 | $39,730 | $3,960 | $35,770 |
| 2016 | $2,669 | $39,730 | $3,960 | $35,770 |
| 2015 | $3,089 | $39,730 | $3,960 | $35,770 |
| 2014 | $3,089 | $44,140 | $4,410 | $39,730 |
Source: Public Records
Map
Nearby Homes
- 8241 Lewis Rd
- 8757 Roberts Ct Unit 25C
- 0
- Anderson Plan at Smokestack Trails
- Bramante Ranch Plan at Smokestack Trails
- Hudson Plan at Smokestack Trails
- Columbia Plan at Smokestack Trails
- Lehigh Plan at Smokestack Trails
- 136 River Rock Way Unit D
- 100 River Rock Way
- 396 Crossbrook Dr
- Caroline Plan at Falls Landing - Villas
- Wexford Plan at Falls Landing - Villas
- Rosecliff Plan at Falls Landing - Villas
- 105 Clay Ct
- 260 Stone Ridge Way
- 25950 Bagley Rd
- 228 Stone Ridge Way
- 109 Marble Ct
- 281-12-024 River Rd
- 24525 Grove Pond Way Unit S48
- 24490 Meadow Ln Unit Q42
- 24570 Meadow Ln Unit Q43
- 24580 Meadow Ln Unit Q44
- 24719 Grove Pond Way Unit R45
- 24713 Grove Pond Way Unit 46
- 24713 Grove Pond Way Unit 4
- 24480 Grove Pond Way Unit T50
- 24485 Grove Pond Way
- 24600 Grove Pond Way Unit U53
- 24500 Grove Pond Way Unit U51
- 24550 Grove Pond Way
- 24550 Grove Pond Way Unit 52
- 8636 Graham Cir
- 24712 Grove Pond Way Unit W58
- 24708 Grove Pond Way Unit W57
- 24650 Grove Pond Way
- 24700 Grove Pond Way Unit V55
- 24591 Meadow Ln Unit N35
- 24619 Meadow Ln Unit N34