Estimated Value: $46,000 - $192,000
Studio
--
Bath
2,085
Sq Ft
$57/Sq Ft
Est. Value
About This Home
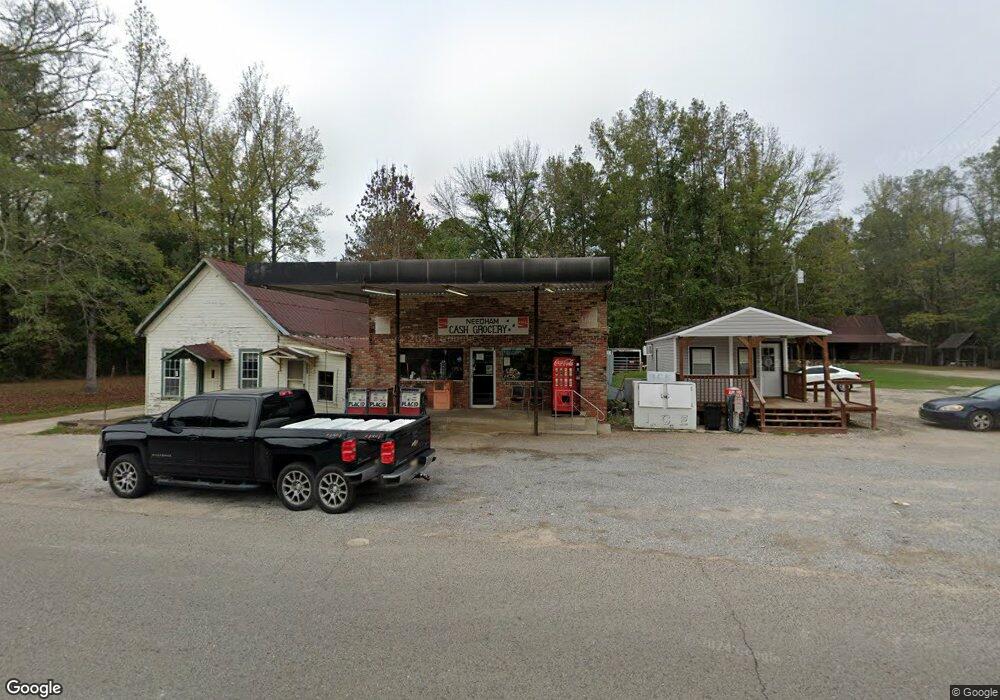
This home is located at 2458 Needham Rd, Toxey, AL 36921 and is currently estimated at $119,000, approximately $57 per square foot. 2458 Needham Rd is a home.
Ownership History
Date
Name
Owned For
Owner Type
Purchase Details
Closed on
Feb 21, 1996
Sold by
Turner Marvin R
Bought by
Mciiwain Alan K and Mciiwain Tammy T
Current Estimated Value
Purchase Details
Closed on
Oct 11, 1993
Create a Home Valuation Report for This Property
The Home Valuation Report is an in-depth analysis detailing your home's value as well as a comparison with similar homes in the area
Purchase History
| Date | Buyer | Sale Price | Title Company |
|---|---|---|---|
| Mciiwain Alan K | -- | -- | |
| -- | -- | -- |
Source: Public Records
Tax History
| Year | Tax Paid | Tax Assessment Tax Assessment Total Assessment is a certain percentage of the fair market value that is determined by local assessors to be the total taxable value of land and additions on the property. | Land | Improvement |
|---|---|---|---|---|
| 2024 | $131 | $7,318 | $1,480 | $5,838 |
| 2023 | $127 | $6,222 | $1,390 | $4,832 |
| 2022 | $127 | $6,222 | $1,390 | $4,832 |
| 2021 | $127 | $6,222 | $1,390 | $4,832 |
| 2020 | $127 | $6,222 | $1,390 | $4,832 |
| 2019 | $135 | $6,492 | $1,400 | $5,092 |
| 2018 | $135 | $64,920 | $0 | $0 |
| 2017 | $135 | $64,920 | $0 | $0 |
| 2016 | $130 | $63,920 | $0 | $0 |
| 2015 | $135 | $65,290 | $0 | $0 |
| 2014 | $135 | $65,290 | $0 | $0 |
| 2012 | $135 | $65,290 | $0 | $0 |
Source: Public Records
Map
Nearby Homes
- O Hwy 17
- 0 Pleasant Hill Rd
- 1 Pleasant Hill Rd
- 0 Wisteria Cir S
- Gibson Rd
- 1 Mount Olive Rd
- Highway 20 Unit @ Crest Road
- 137 Spruce Rd
- 3483 Barrytown Rd
- 0 Ararat Rd Tract B
- 0 Ararat Rd Tract C
- 0 James Dr
- Little Grove Hill Rd
- 1775 International Paper Rd
- 1785 International Paper Rd
- 112 County Road 662
- 0 Al-69
- 0 County Rd 32
- 6643 County Road 630
- 0 County Road 425
- 23684 Highway 17
- 23841 Highway 17
- 590 Griffin Rd
- 674 Griffin Rd
- 23405 Highway 17
- 523 Griffin Rd
- 23333 Highway 17
- 23216 Highway 17
- 23976 Highway 17
- 374 Griffin Rd
- 359 Griffin Rd
- 314 Griffin Rd
- 23020 Highway 17
- 23081 Highway 17
- 1862 Needham Rd
- 337 Land Rd
- 22960 Highway 17
- 377 Land Rd
- 467 Land Rd
- 22837 Highway 17
Your Personal Tour Guide
Ask me questions while you tour the home.