Estimated Value: $725,081 - $786,000
5
Beds
4
Baths
3,739
Sq Ft
$203/Sq Ft
Est. Value
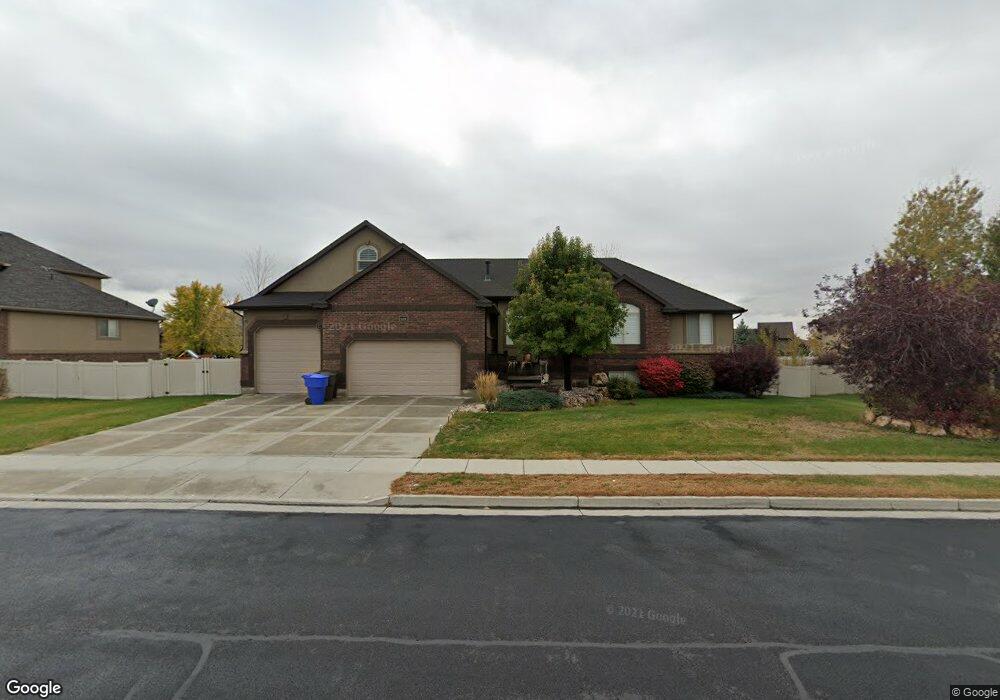
About This Home
This home is located at 2459 N 2575 W, Ogden, UT 84404 and is currently estimated at $757,520, approximately $202 per square foot. 2459 N 2575 W is a home located in Weber County with nearby schools including Farr West Elementary School, Wahlquist Junior High School, and Fremont High School.
Ownership History
Date
Name
Owned For
Owner Type
Purchase Details
Closed on
Apr 23, 2020
Sold by
Greenhalgh Riley D and Greenhalgh Paige L
Bought by
Greenhalgh Riley and Greenhalgh Paige
Current Estimated Value
Home Financials for this Owner
Home Financials are based on the most recent Mortgage that was taken out on this home.
Original Mortgage
$395,000
Outstanding Balance
$349,257
Interest Rate
3.3%
Mortgage Type
New Conventional
Estimated Equity
$408,263
Purchase Details
Closed on
Jul 19, 2007
Sold by
Gray Stone Development Inc
Bought by
Chugg Matthew J and Chugg Kristin
Home Financials for this Owner
Home Financials are based on the most recent Mortgage that was taken out on this home.
Original Mortgage
$68,341
Interest Rate
6.62%
Mortgage Type
Stand Alone Second
Purchase Details
Closed on
Sep 19, 2006
Sold by
Tjb Construction Inc
Bought by
Gray Stone Development Inc
Create a Home Valuation Report for This Property
The Home Valuation Report is an in-depth analysis detailing your home's value as well as a comparison with similar homes in the area
Home Values in the Area
Average Home Value in this Area
Purchase History
| Date | Buyer | Sale Price | Title Company |
|---|---|---|---|
| Greenhalgh Riley | -- | Hickman Land Title Co | |
| Chugg Matthew J | -- | Bonneville Superior Title Co | |
| Gray Stone Development Inc | -- | Bonneville Superior Title Co |
Source: Public Records
Mortgage History
| Date | Status | Borrower | Loan Amount |
|---|---|---|---|
| Open | Greenhalgh Riley | $395,000 | |
| Closed | Chugg Matthew J | $68,341 | |
| Closed | Chugg Matthew J | $273,366 |
Source: Public Records
Tax History
| Year | Tax Paid | Tax Assessment Tax Assessment Total Assessment is a certain percentage of the fair market value that is determined by local assessors to be the total taxable value of land and additions on the property. | Land | Improvement |
|---|---|---|---|---|
| 2025 | $3,968 | $692,374 | $200,613 | $491,761 |
| 2024 | $3,937 | $384,449 | $110,337 | $274,112 |
| 2023 | $3,724 | $359,700 | $110,144 | $249,556 |
| 2022 | $4,116 | $406,450 | $99,268 | $307,182 |
| 2021 | $3,474 | $579,000 | $105,358 | $473,642 |
| 2020 | $3,117 | $476,000 | $85,335 | $390,665 |
| 2019 | $3,049 | $440,000 | $85,292 | $354,708 |
| 2018 | $3,091 | $427,000 | $85,292 | $341,708 |
| 2017 | $2,753 | $369,000 | $78,197 | $290,803 |
| 2016 | $2,720 | $196,923 | $36,096 | $160,827 |
| 2015 | $2,129 | $151,794 | $36,096 | $115,698 |
| 2014 | $1,925 | $133,812 | $33,205 | $100,607 |
Source: Public Records
Map
Nearby Homes
- 2624 W 2225 N
- 2495 N 2850 W
- 2910 N Galloway Ln Unit 266
- 2709 N Galloway Ln Unit 174
- 2708 N Galloway Ln Unit 132
- 2673 W 2125 N
- 2307 N 2850 W
- 2809 W 2175 N
- 2287 N 2850 W
- 2810 W Guernsey Ln Unit 222
- 2522 N 2200 W
- 2830 W Guernsey Ln Unit 219
- 2821 W 2705 N Unit 91
- 2581 W 2825 N
- 2777 W 2710 N Unit 117
- 2443 W 2950 N Unit 99
- 2838 W 2705 N Unit 71
- 2847 W 2720 N Unit 75
- 2837 W 2720 N Unit 74
- 2762 W 2775 N Unit 153
- 2443 N 2575 W
- 2443 N 2575 W Unit 93
- 2473 N 2575 W
- 2473 N 2575 W Unit 95
- 2438 N 2600 W
- 2438 N 2600 W Unit 111
- 2606 W 2450 N
- 2427 N 2575 W
- 2487 N 2575 W
- 2424 N 2600 W
- 2466 N 2575 W
- 2466 N 2575 W Unit 85
- 2452 N 2575 W
- 2490 N 2575 W
- 2490 N 2575 W Unit 83
- 2478 N 2575 W
- 2595 W 2500 N
- 2436 N 2575 W
- 2436 N 2575 W Unit 87
- 2409 N 2575 W
Your Personal Tour Guide
Ask me questions while you tour the home.