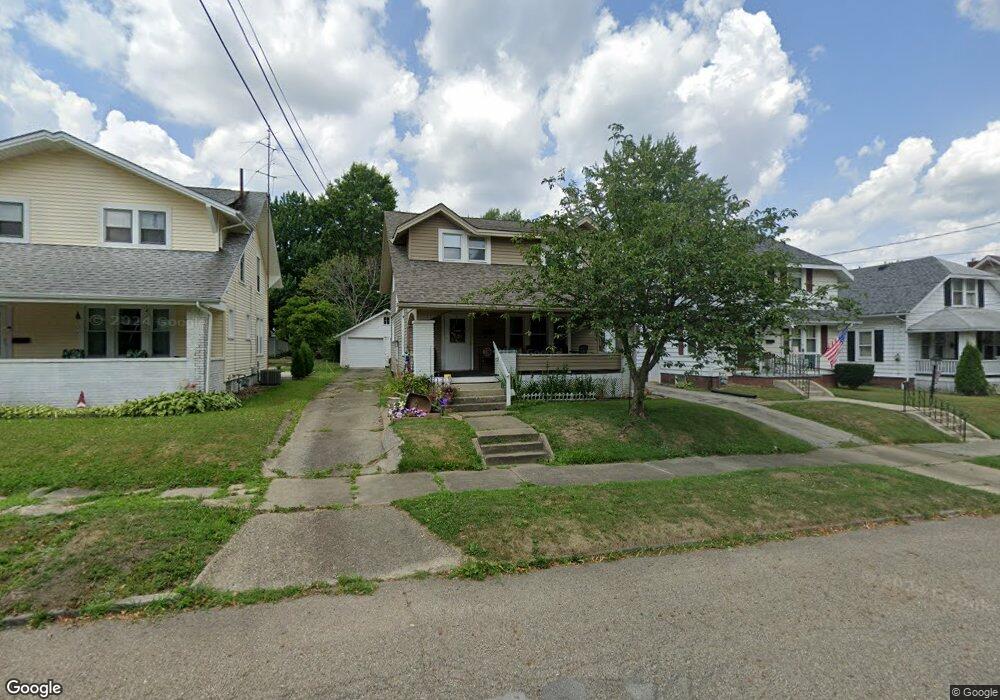
2459 S Linden Ave Alliance, OH 44601
Estimated Value: $103,000 - $155,000
3
Beds
2
Baths
1,344
Sq Ft
$98/Sq Ft
Est. Value
About This Home
This home is located at 2459 S Linden Ave, Alliance, OH 44601 and is currently estimated at $131,614, approximately $97 per square foot. 2459 S Linden Ave is a home located in Stark County with nearby schools including Alliance Elementary School at Rockhill, Alliance Intermediate School at Northside, and Alliance Middle School.
Ownership History
Date
Name
Owned For
Owner Type
Purchase Details
Closed on
Apr 16, 2009
Sold by
Powell Timothy W and Powell Sabrina M
Bought by
Feels Like Home Properties Llc
Current Estimated Value
Purchase Details
Closed on
Feb 18, 2004
Sold by
Us Bank Consumer Finance Na
Bought by
Powell Timothy W and Powell Sabrina M
Home Financials for this Owner
Home Financials are based on the most recent Mortgage that was taken out on this home.
Original Mortgage
$45,050
Interest Rate
5.65%
Mortgage Type
Purchase Money Mortgage
Purchase Details
Closed on
Apr 29, 2003
Sold by
Slimak John Paul and Logan Holly Ann
Bought by
Us Bank Consumer Finance Na and Star Bank Na
Purchase Details
Closed on
Apr 15, 2003
Sold by
Slimak Kathleen L and Mckinnen Kathleen L
Bought by
Us Bank Consumer Finance Na and Star Bank Na
Purchase Details
Closed on
Sep 14, 1995
Sold by
Goodrich Paul E
Bought by
Slimak John and Slimak Kathleen
Purchase Details
Closed on
Feb 3, 1994
Create a Home Valuation Report for This Property
The Home Valuation Report is an in-depth analysis detailing your home's value as well as a comparison with similar homes in the area
Home Values in the Area
Average Home Value in this Area
Purchase History
| Date | Buyer | Sale Price | Title Company |
|---|---|---|---|
| Feels Like Home Properties Llc | -- | Attorney | |
| Powell Timothy W | $53,000 | Nations Title Agency Of Ohio | |
| Us Bank Consumer Finance Na | -- | -- | |
| Us Bank Consumer Finance Na | -- | -- | |
| Slimak John | $34,800 | -- | |
| -- | -- | -- |
Source: Public Records
Mortgage History
| Date | Status | Borrower | Loan Amount |
|---|---|---|---|
| Previous Owner | Powell Timothy W | $45,050 |
Source: Public Records
Tax History Compared to Growth
Tax History
| Year | Tax Paid | Tax Assessment Tax Assessment Total Assessment is a certain percentage of the fair market value that is determined by local assessors to be the total taxable value of land and additions on the property. | Land | Improvement |
|---|---|---|---|---|
| 2025 | -- | $44,100 | $8,610 | $35,490 |
| 2024 | -- | $44,100 | $8,610 | $35,490 |
| 2023 | $1,319 | $30,530 | $6,270 | $24,260 |
| 2022 | $1,265 | $30,530 | $6,270 | $24,260 |
| 2021 | $1,268 | $30,530 | $6,270 | $24,260 |
| 2020 | $1,160 | $26,080 | $5,430 | $20,650 |
| 2019 | $1,144 | $26,080 | $5,430 | $20,650 |
| 2018 | $1,150 | $26,080 | $5,430 | $20,650 |
| 2017 | $1,026 | $22,860 | $4,690 | $18,170 |
| 2016 | $824 | $18,210 | $4,690 | $13,520 |
| 2015 | $831 | $18,210 | $4,690 | $13,520 |
| 2014 | $843 | $17,580 | $4,520 | $13,060 |
| 2013 | $421 | $17,580 | $4,520 | $13,060 |
Source: Public Records
Map
Nearby Homes
- 2460 S Arch Ave
- 2408 S Linden Ave
- 236 E Milton St
- 2376 S Seneca Ave
- 2218 S Freedom Ave
- 555 E Milton St
- 317 E State St
- 853 Fairway Dr
- 1846 S Freedom Ave
- 390 E College St
- 112 E College St
- 1475 Chatauqua Ct
- 1437 S Linden Ave
- 815 Grace St
- 729 Waugh St
- 1395 S Webb Ave
- 2839 S Rockhill Ave
- 551 South St
- 3101 Ridgehill Ave
- 1233 Woodland Ave
- 2467 S Linden Ave
- 2455 S Linden Ave
- 2479 S Linden Ave
- 2443 S Linden Ave
- 2505 S Linden Ave
- 2433 S Linden Ave
- 2515 S Linden Ave
- 2470 S Arch Ave
- 2425 S Linden Ave
- 2478 S Arch Ave
- 2442 S Arch Ave
- 2500 S Arch Ave
- 2436 S Arch Ave
- 2460 S Linden Ave
- 2525 S Linden Ave
- 2452 S Linden Ave
- 2468 S Linden Ave
- 2415 S Linden Ave
- 2444 S Linden Ave
- 2478 S Linden Ave