Estimated Value: $169,000 - $515,000
4
Beds
2
Baths
2,170
Sq Ft
$158/Sq Ft
Est. Value
About This Home
This home is located at 2459 Stewart Rd, Xenia, OH 45385 and is currently estimated at $342,000, approximately $157 per square foot. 2459 Stewart Rd is a home located in Greene County with nearby schools including Bell Creek Intermediate School, Stephen Bell Elementary School, and Bellbrook Middle School.
Ownership History
Date
Name
Owned For
Owner Type
Purchase Details
Closed on
Mar 17, 2021
Sold by
Mclean Living Trust and Johnson Jeremey J
Bought by
Ashgard Group Llc
Current Estimated Value
Home Financials for this Owner
Home Financials are based on the most recent Mortgage that was taken out on this home.
Original Mortgage
$200,000
Interest Rate
3%
Mortgage Type
New Conventional
Purchase Details
Closed on
Aug 5, 2009
Sold by
Mclean Terence D and Mclean Carol M
Bought by
Mclean Terence Daniel and Mclean Carol Maxine
Create a Home Valuation Report for This Property
The Home Valuation Report is an in-depth analysis detailing your home's value as well as a comparison with similar homes in the area
Home Values in the Area
Average Home Value in this Area
Purchase History
| Date | Buyer | Sale Price | Title Company |
|---|---|---|---|
| Ashgard Group Llc | -- | None Listed On Document | |
| Mclean Terence Daniel | -- | Attorney |
Source: Public Records
Mortgage History
| Date | Status | Borrower | Loan Amount |
|---|---|---|---|
| Previous Owner | Ashgard Group Llc | $200,000 |
Source: Public Records
Tax History Compared to Growth
Tax History
| Year | Tax Paid | Tax Assessment Tax Assessment Total Assessment is a certain percentage of the fair market value that is determined by local assessors to be the total taxable value of land and additions on the property. | Land | Improvement |
|---|---|---|---|---|
| 2024 | $1,432 | $25,410 | $25,410 | $0 |
| 2023 | $1,432 | $25,410 | $25,410 | $0 |
| 2022 | $1,566 | $23,100 | $23,100 | $0 |
| 2021 | $1,583 | $23,100 | $23,100 | $0 |
| 2020 | $1,481 | $23,100 | $23,100 | $0 |
| 2019 | $1,614 | $23,100 | $23,100 | $0 |
| 2018 | $1,617 | $23,100 | $23,100 | $0 |
| 2017 | $1,668 | $23,100 | $23,100 | $0 |
| 2016 | $1,668 | $23,100 | $23,100 | $0 |
| 2015 | $1,643 | $23,100 | $23,100 | $0 |
| 2014 | $1,521 | $23,100 | $23,100 | $0 |
Source: Public Records
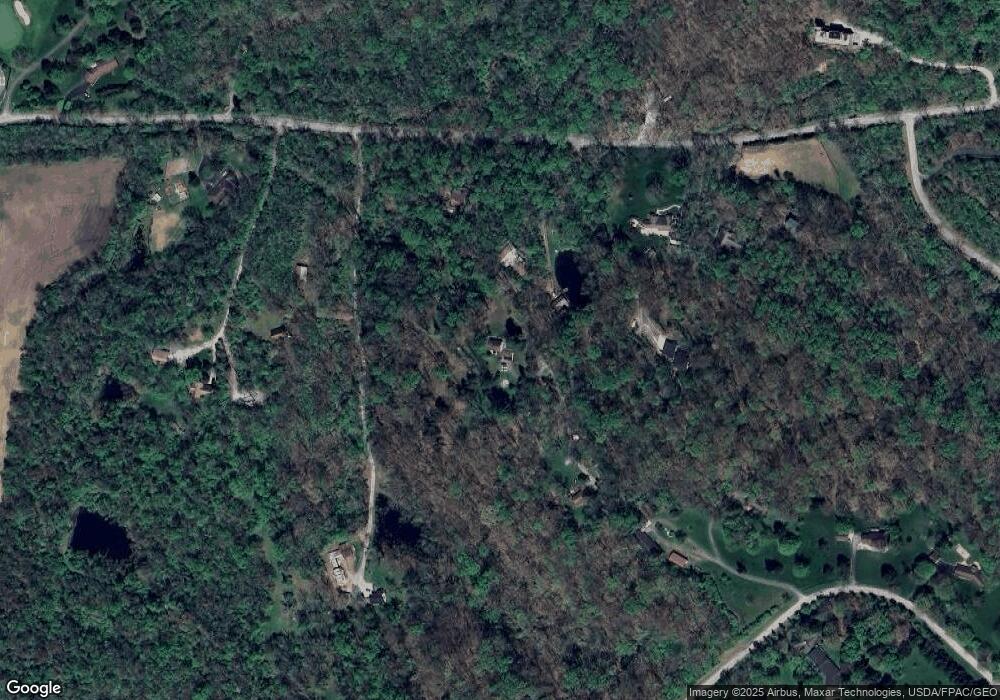
Map
Nearby Homes
- 2185 Tanbark Trail
- 1591 Valley Heights Rd
- 1753 Cedar Ridge Dr
- 2995 Upper Bellbrook Rd
- 1711 Mcclellan Rd
- 1061 Mcpherson Rd
- 2230 Little Miami Dr
- 2018 Amberwood Ct
- 2436 Sherbourne Way
- 295 Stratford Ln
- 1474 Hawkshead St
- 717 S Alpha Bellbrook Rd
- 463 Valhalla Ct
- 1272 Baybury Ave
- 1292 Baybury Ave
- Henley Plan at Edenbridge
- Holcombe Plan at Edenbridge
- Newcastle Plan at Edenbridge
- Bellamy Plan at Edenbridge
- Chatham Plan at Edenbridge
- 2459 Stewart Rd
- 2415 Stewart Rd
- 2463 Stewart Rd
- 2361 Stewart Rd
- 2371 Stewart Rd
- 2475 Stewart Rd
- 2455 Stewart Rd
- 2333 Stewart Rd
- 1341 Sugar Hill Ln
- 2485 Stewart Rd
- 1309 Sugar Hill Ln
- 2525 Stewart Rd
- 1389 Sugar Hill Ln
- 2496 Stewart Rd
- 1289 Sugar Hill Ln
- 2494 Stewart Rd
- 2500 Stewart Rd
- 2484 Stewart Rd
- 1300 Sugar Hill Ln
- 2300 Stewart Rd