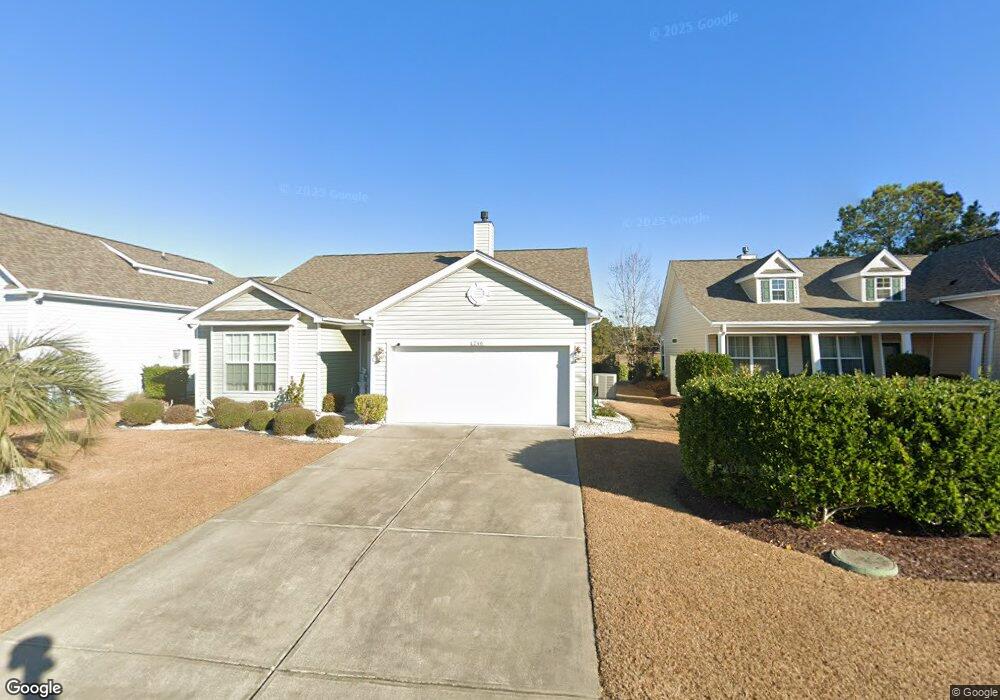
246 Carolina Farms Blvd Unit LOT 413;PHASE 9 Calabash, NC 28467
Estimated Value: $289,000 - $305,000
3
Beds
2
Baths
1,900
Sq Ft
$156/Sq Ft
Est. Value
About This Home
This home is located at 246 Carolina Farms Blvd Unit LOT 413;PHASE 9, Calabash, NC 28467 and is currently estimated at $296,076, approximately $155 per square foot. 246 Carolina Farms Blvd Unit LOT 413;PHASE 9 is a home located in Brunswick County with nearby schools including Jessie Mae Monroe Elementary School, Shallotte Middle School, and West Brunswick High School.
Ownership History
Date
Name
Owned For
Owner Type
Purchase Details
Closed on
Jun 14, 2013
Sold by
Baron Karen D
Bought by
Kirby Janice and Efird Stephanie
Current Estimated Value
Purchase Details
Closed on
Feb 8, 2013
Sold by
Baron Karen D
Bought by
Baron Karen D and Baron John A
Home Financials for this Owner
Home Financials are based on the most recent Mortgage that was taken out on this home.
Original Mortgage
$123,000
Interest Rate
3.4%
Mortgage Type
New Conventional
Purchase Details
Closed on
Apr 7, 2011
Sold by
Baron John A and Baron Karen D
Bought by
Baron Karen D
Purchase Details
Closed on
May 15, 2009
Sold by
D R Horton Inc
Bought by
Baron John A and Baron Karen D
Home Financials for this Owner
Home Financials are based on the most recent Mortgage that was taken out on this home.
Original Mortgage
$122,630
Interest Rate
4.79%
Mortgage Type
Purchase Money Mortgage
Create a Home Valuation Report for This Property
The Home Valuation Report is an in-depth analysis detailing your home's value as well as a comparison with similar homes in the area
Home Values in the Area
Average Home Value in this Area
Purchase History
| Date | Buyer | Sale Price | Title Company |
|---|---|---|---|
| Kirby Janice | $148,000 | None Available | |
| Baron Karen D | -- | None Available | |
| Baron Karen D | -- | None Available | |
| Baron John A | $183,000 | None Available |
Source: Public Records
Mortgage History
| Date | Status | Borrower | Loan Amount |
|---|---|---|---|
| Previous Owner | Baron Karen D | $123,000 | |
| Previous Owner | Baron John A | $122,630 |
Source: Public Records
Tax History Compared to Growth
Tax History
| Year | Tax Paid | Tax Assessment Tax Assessment Total Assessment is a certain percentage of the fair market value that is determined by local assessors to be the total taxable value of land and additions on the property. | Land | Improvement |
|---|---|---|---|---|
| 2025 | $1,440 | $280,470 | $40,000 | $240,470 |
| 2024 | $1,440 | $280,470 | $40,000 | $240,470 |
| 2023 | $1,221 | $280,470 | $40,000 | $240,470 |
| 2022 | $1,221 | $174,100 | $25,000 | $149,100 |
| 2021 | $1,221 | $174,100 | $25,000 | $149,100 |
| 2020 | $1,178 | $174,100 | $25,000 | $149,100 |
| 2019 | $1,178 | $26,420 | $25,000 | $1,420 |
| 2018 | $1,070 | $26,660 | $25,000 | $1,660 |
| 2017 | $1,070 | $26,660 | $25,000 | $1,660 |
| 2016 | $1,045 | $26,660 | $25,000 | $1,660 |
| 2015 | $1,045 | $161,170 | $25,000 | $136,170 |
| 2014 | $961 | $158,181 | $25,000 | $133,181 |
Source: Public Records
Map
Nearby Homes
- 504 Slippery Rock Way
- 520 Slippery Rock Way
- 458 Slippery Rock Way
- 1303 Sunny Slope Cir
- 1354 Fence Post Ln
- 3095 Crescent Lake Dr
- 1339 Sunny Slope Cir
- 11 Picket Fence Ln
- 1345 Sunny Slope Cir
- 94 Field Planters Cir Unit 94
- 94 Field Planters Cir
- 1353 Sunny Slope Cir
- 90 Field Planters Cir
- 1357 Sunny Slope Cir
- 19 Cattle Run Ln
- 100 Cobblers Cir
- 3070 Crescent Lake Dr
- 850 Meadow Ln SW
- 610 Silos Way
- 484 Cornflower St
- 246 Carolina Farms Blvd
- 246 Carolina Farms Blvd Unit 413
- 248 Carolina Farms Blvd
- 248 Carolina Farms Blvd Unit Lot 414, Phase 9
- 244 Carolina Farms Blvd
- 244 Carolina Farms Blvd Unit Lot 412, Phase 9
- 244 Carolina Farms Blvd Unit 412
- 250 Carolina Farms Blvd
- 242 Carolina Farms Blvd
- 242 Carolina Farms Blvd Unit 411
- 240 Carolina Farms Blvd
- 240 Carolina Farms Blvd Unit LOT 410;PHASE 9
- 238 Carolina Farms Blvd
- 236 Carolina Farms Blvd
- 245 Carolina Farms Blvd Unit 416
- 253 Carolina Farms Blvd
- 254 Carolina Farms Blvd
- 254 Carolina Farms Blvd Unit 416
- 492 Slippery Rock Way
- 490 Slippery Rock Way