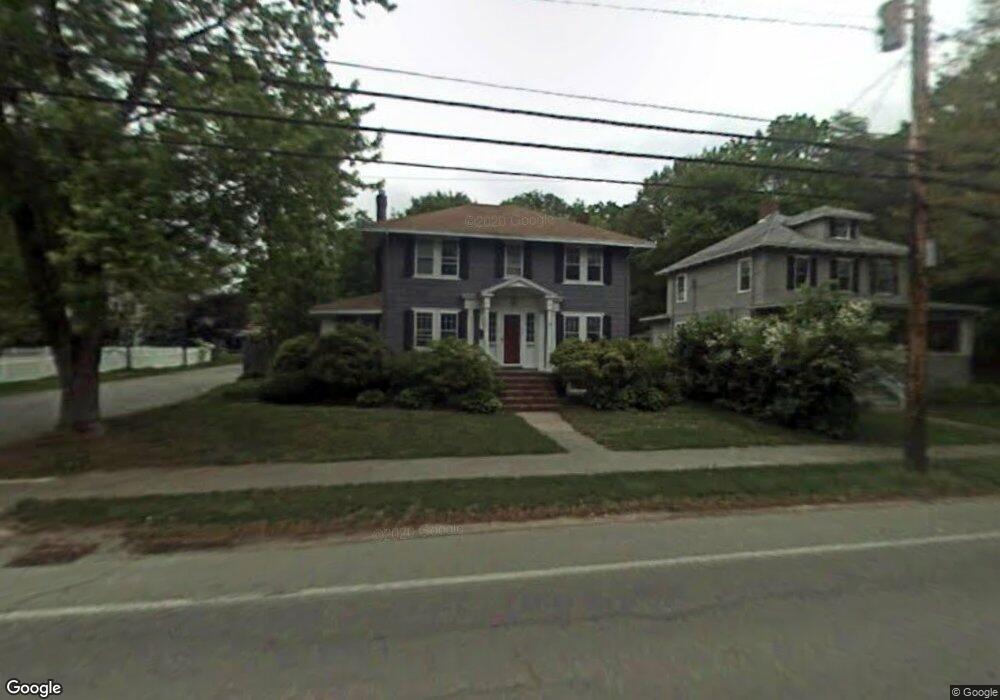
246 Central St Hingham, MA 02043
Estimated Value: $1,104,438 - $1,373,000
3
Beds
3
Baths
2,024
Sq Ft
$609/Sq Ft
Est. Value
About This Home
This home is located at 246 Central St, Hingham, MA 02043 and is currently estimated at $1,233,110, approximately $609 per square foot. 246 Central St is a home located in Plymouth County with nearby schools including East Elementary School, Hingham Middle School, and Hingham High School.
Ownership History
Date
Name
Owned For
Owner Type
Purchase Details
Closed on
Mar 31, 2003
Sold by
Mcallister Joseph G and Mcallister Diane M
Bought by
Tesler Jamey Lee and Tesler Jamey L
Current Estimated Value
Purchase Details
Closed on
Oct 7, 1992
Sold by
Burke John N and Burke Tracey L
Bought by
Mcallister Joseph G and Mcallister Diane M
Purchase Details
Closed on
Nov 17, 1989
Sold by
White Francis P
Bought by
Burke John N
Create a Home Valuation Report for This Property
The Home Valuation Report is an in-depth analysis detailing your home's value as well as a comparison with similar homes in the area
Purchase History
| Date | Buyer | Sale Price | Title Company |
|---|---|---|---|
| Tesler Jamey Lee | $514,450 | -- | |
| Mcallister Joseph G | $183,000 | -- | |
| Burke John N | $168,000 | -- |
Source: Public Records
Mortgage History
| Date | Status | Borrower | Loan Amount |
|---|---|---|---|
| Open | Burke John N | $417,000 | |
| Closed | Burke John N | $95,000 |
Source: Public Records
Tax History
| Year | Tax Paid | Tax Assessment Tax Assessment Total Assessment is a certain percentage of the fair market value that is determined by local assessors to be the total taxable value of land and additions on the property. | Land | Improvement |
|---|---|---|---|---|
| 2025 | $9,988 | $934,300 | $504,100 | $430,200 |
| 2024 | $9,441 | $870,100 | $504,100 | $366,000 |
| 2023 | $8,373 | $837,300 | $504,100 | $333,200 |
| 2022 | $7,945 | $687,300 | $420,100 | $267,200 |
| 2021 | $8,043 | $681,600 | $437,600 | $244,000 |
| 2020 | $7,859 | $681,600 | $437,600 | $244,000 |
| 2019 | $7,868 | $666,200 | $437,600 | $228,600 |
| 2018 | $7,007 | $595,300 | $350,100 | $245,200 |
| 2017 | $6,592 | $538,100 | $327,500 | $210,600 |
| 2016 | $6,526 | $522,500 | $311,900 | $210,600 |
| 2015 | $6,361 | $507,700 | $297,100 | $210,600 |
Source: Public Records
Map
Nearby Homes
Your Personal Tour Guide
Ask me questions while you tour the home.