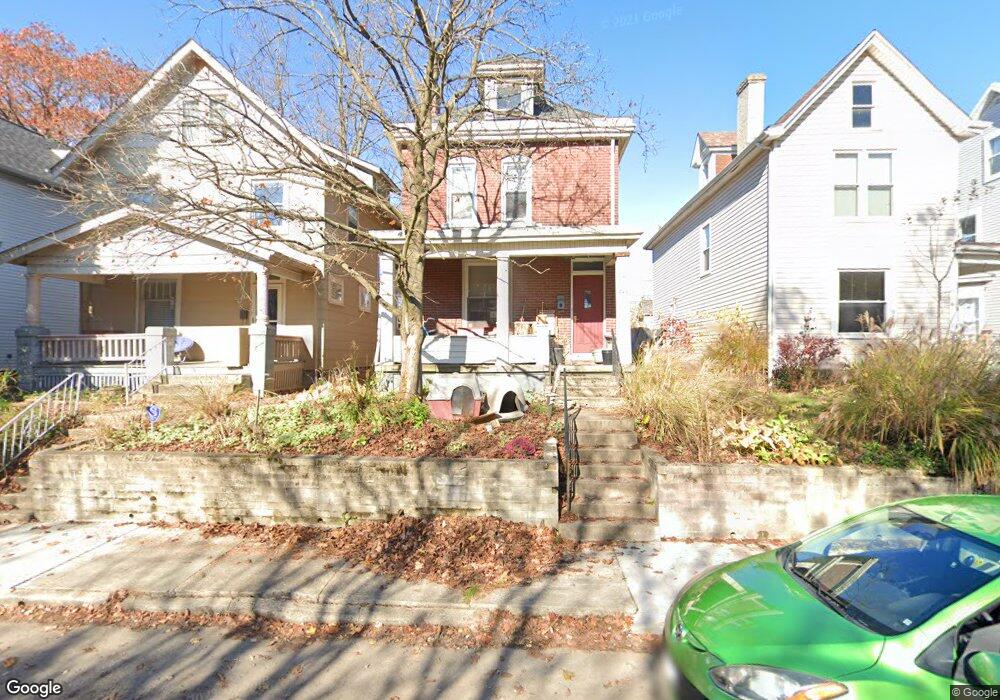
246 E Maynard Ave Columbus, OH 43202
Old North Columbus NeighborhoodEstimated Value: $279,000 - $303,467
3
Beds
1
Bath
1,238
Sq Ft
$235/Sq Ft
Est. Value
About This Home
This home is located at 246 E Maynard Ave, Columbus, OH 43202 and is currently estimated at $290,617, approximately $234 per square foot. 246 E Maynard Ave is a home located in Franklin County with nearby schools including Hubbard Elementary School, Dominion Middle School, and Whetstone High School.
Ownership History
Date
Name
Owned For
Owner Type
Purchase Details
Closed on
Mar 13, 2006
Sold by
Felter Fredrick A and Felter Nicole
Bought by
Adams Alicia D
Current Estimated Value
Home Financials for this Owner
Home Financials are based on the most recent Mortgage that was taken out on this home.
Original Mortgage
$141,573
Outstanding Balance
$78,939
Interest Rate
6.33%
Mortgage Type
FHA
Estimated Equity
$211,678
Purchase Details
Closed on
Jun 9, 1999
Sold by
Smithson Charles B
Bought by
Felter Fredrick A
Home Financials for this Owner
Home Financials are based on the most recent Mortgage that was taken out on this home.
Original Mortgage
$94,050
Interest Rate
7.06%
Mortgage Type
FHA
Purchase Details
Closed on
Apr 18, 1996
Sold by
Ward Daniel R
Bought by
John H Williams
Home Financials for this Owner
Home Financials are based on the most recent Mortgage that was taken out on this home.
Original Mortgage
$47,700
Interest Rate
7.44%
Mortgage Type
New Conventional
Purchase Details
Closed on
Jul 1, 1985
Create a Home Valuation Report for This Property
The Home Valuation Report is an in-depth analysis detailing your home's value as well as a comparison with similar homes in the area
Home Values in the Area
Average Home Value in this Area
Purchase History
| Date | Buyer | Sale Price | Title Company |
|---|---|---|---|
| Adams Alicia D | $143,000 | Title First | |
| Felter Fredrick A | $96,200 | Chicago Title | |
| John H Williams | $20,300 | -- | |
| -- | $35,000 | -- |
Source: Public Records
Mortgage History
| Date | Status | Borrower | Loan Amount |
|---|---|---|---|
| Open | Adams Alicia D | $141,573 | |
| Previous Owner | Felter Fredrick A | $94,050 | |
| Previous Owner | John H Williams | $47,700 |
Source: Public Records
Tax History
| Year | Tax Paid | Tax Assessment Tax Assessment Total Assessment is a certain percentage of the fair market value that is determined by local assessors to be the total taxable value of land and additions on the property. | Land | Improvement |
|---|---|---|---|---|
| 2025 | $4,748 | $103,610 | $27,410 | $76,200 |
| 2024 | $4,748 | $103,610 | $27,410 | $76,200 |
| 2023 | $4,689 | $103,600 | $27,405 | $76,195 |
| 2022 | $3,140 | $59,090 | $16,420 | $42,670 |
| 2021 | $3,146 | $59,090 | $16,420 | $42,670 |
| 2020 | $3,151 | $59,090 | $16,420 | $42,670 |
| 2019 | $2,939 | $47,260 | $13,130 | $34,130 |
| 2018 | $2,893 | $47,260 | $13,130 | $34,130 |
| 2017 | $3,040 | $47,260 | $13,130 | $34,130 |
| 2016 | $3,142 | $47,430 | $6,550 | $40,880 |
| 2015 | $2,852 | $47,430 | $6,550 | $40,880 |
| 2014 | $2,859 | $47,430 | $6,550 | $40,880 |
| 2013 | $1,282 | $43,120 | $5,950 | $37,170 |
Source: Public Records
Map
Nearby Homes
- 2343 Indianola Ave
- 210 E Blake Ave
- 2362 Indiana Ave
- 2458- 2458 1 2 Deming Ave
- 2395 Summit St Unit 397
- 2478-2480 Deming Ave
- 2470 Indianola Ave
- 68 E Oakland Ave
- 2295 N 4th St
- 23 E Maynard Ave
- 2210-2212 N 4th St
- 6 E Blake Ave
- 9 E Norwich Ave Unit 15
- 525-527 E Tompkins St
- 2555 Glenmawr Ave
- 2539 N 4th St Unit 539
- 2082 N 4th St
- 415 Glen Echo Cir
- 2394 Neil Ave
- 109 E Arcadia Ave
- 240 E Maynard Ave
- 250 E Maynard Ave
- 236 E Maynard Ave
- 252 E Maynard Ave
- 232 E Maynard Ave
- 258 E Maynard Ave
- 260 E Maynard Ave Unit 262
- 228 E Maynard Ave
- 251 E Blake Ave
- 255 E Blake Ave
- 247 E Blake Ave
- 259 E Blake Ave
- 224 E Maynard Ave
- 263 E Blake Ave
- 237 E Blake Ave Unit 239
- 245 E Maynard Ave
- 249 E Maynard Ave
- 239 E Maynard Ave
- 235 E Maynard Ave
- 251 E Maynard Ave Unit 253
Your Personal Tour Guide
Ask me questions while you tour the home.