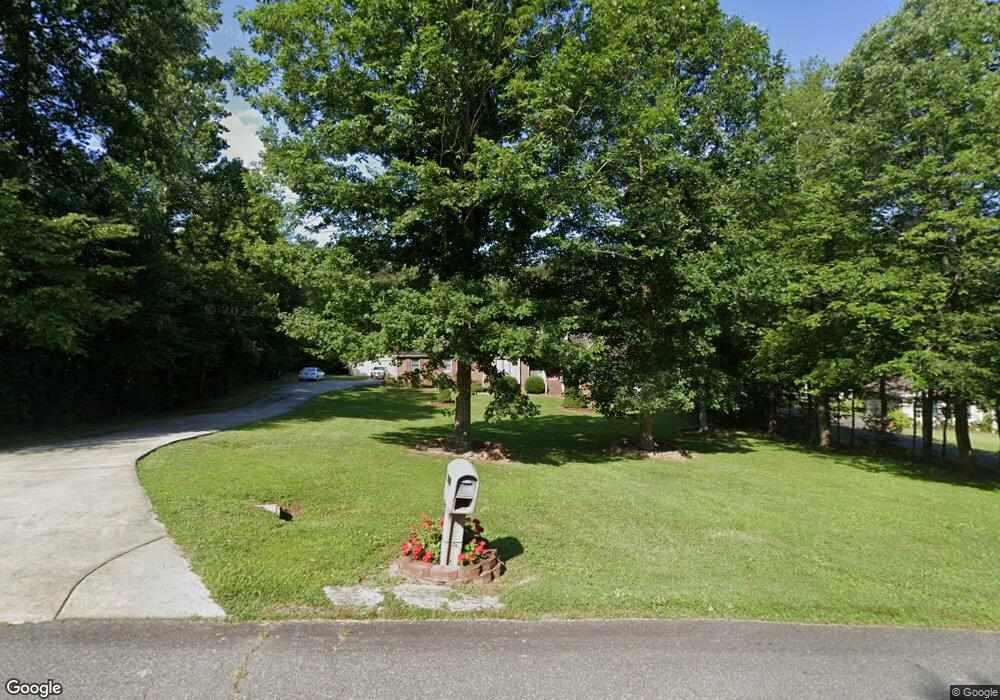
246 Edgar Allan Dr Stoneville, NC 27048
Estimated Value: $320,000 - $366,000
--
Bed
--
Bath
2,194
Sq Ft
$154/Sq Ft
Est. Value
About This Home
This home is located at 246 Edgar Allan Dr, Stoneville, NC 27048 and is currently estimated at $337,791, approximately $153 per square foot. 246 Edgar Allan Dr is a home located in Rockingham County with nearby schools including Douglass Elementary School, J.E. Holmes Middle School, and John M. Morehead High School.
Ownership History
Date
Name
Owned For
Owner Type
Purchase Details
Closed on
Aug 22, 2020
Sold by
Edwards Vanessa L and Edwards Timothy L
Bought by
Bailey Fred N and Bailey Melissa P
Current Estimated Value
Home Financials for this Owner
Home Financials are based on the most recent Mortgage that was taken out on this home.
Original Mortgage
$176,212
Outstanding Balance
$156,021
Interest Rate
2.9%
Mortgage Type
New Conventional
Estimated Equity
$181,770
Purchase Details
Closed on
Nov 15, 2005
Sold by
French Gordon Rae and French Betty Teaster
Bought by
Bank Of America N A
Purchase Details
Closed on
Apr 5, 2005
Sold by
Bank Of America N A
Bought by
Lowe Henry T
Home Financials for this Owner
Home Financials are based on the most recent Mortgage that was taken out on this home.
Original Mortgage
$102,500
Interest Rate
6.29%
Mortgage Type
Purchase Money Mortgage
Create a Home Valuation Report for This Property
The Home Valuation Report is an in-depth analysis detailing your home's value as well as a comparison with similar homes in the area
Home Values in the Area
Average Home Value in this Area
Purchase History
| Date | Buyer | Sale Price | Title Company |
|---|---|---|---|
| Bailey Fred N | $174,500 | None Available | |
| Bank Of America N A | $153,106 | None Available | |
| Lowe Henry T | $150,000 | None Available |
Source: Public Records
Mortgage History
| Date | Status | Borrower | Loan Amount |
|---|---|---|---|
| Open | Bailey Fred N | $176,212 | |
| Previous Owner | Lowe Henry T | $102,500 |
Source: Public Records
Tax History Compared to Growth
Tax History
| Year | Tax Paid | Tax Assessment Tax Assessment Total Assessment is a certain percentage of the fair market value that is determined by local assessors to be the total taxable value of land and additions on the property. | Land | Improvement |
|---|---|---|---|---|
| 2025 | $2,236 | $338,704 | $19,000 | $319,704 |
| 2024 | $2,201 | $338,704 | $19,000 | $319,704 |
| 2023 | $2,201 | $203,611 | $16,000 | $187,611 |
| 2022 | $1,619 | $203,611 | $16,000 | $187,611 |
| 2021 | $1,619 | $203,611 | $16,000 | $187,611 |
| 2020 | $1,619 | $203,611 | $16,000 | $187,611 |
| 2019 | $809 | $203,611 | $16,000 | $187,611 |
| 2018 | $786 | $197,491 | $24,000 | $173,491 |
| 2017 | $786 | $197,491 | $24,000 | $173,491 |
| 2015 | $1,588 | $197,491 | $24,000 | $173,491 |
| 2014 | $1,572 | $197,491 | $24,000 | $173,491 |
Source: Public Records
Map
Nearby Homes
- 131 Calvary Rd
- 00 Eden Rd
- 0 Eden Rd
- 530 Eden Rd
- 150 Fieldale Dr
- 651 Roberts Rd
- 145 Brightwood Rd
- 420 Shady Grove Rd
- 355 Tanglebrook Trail
- 132 Circle Loop
- 122 Legrande Dr
- 2282 Price Rd
- #108 Deer Run
- #103 Deer Run
- #107 Deer Run
- 140 Fox Run
- 130 Fox Run
- #40 & #41 Fox Run
- 4221 Nc Highway 135
- 117 Brammer Rd
- 252 Edgar Allan Dr
- 245 Edgar Allan Dr
- 132 Annabel Ln
- 175 Edgar Allan Dr
- 275 Edgar Allan Dr
- 300 Landors Dr
- 250 Landors Dr
- 308 Landors Dr
- 172 Edgar Allan Dr
- 230 Landors Dr
- 160 Edgar Allan Dr
- 218 Landors Dr
- 192 Landors Dr
- 269 Landors Dr
- 370 Landors Dr
- 130 Tamer Lane Ct
- 239 Landors Dr
- 225 Landors Dr
- 341 Landors Dr
- 120 Edgar Allan Dr