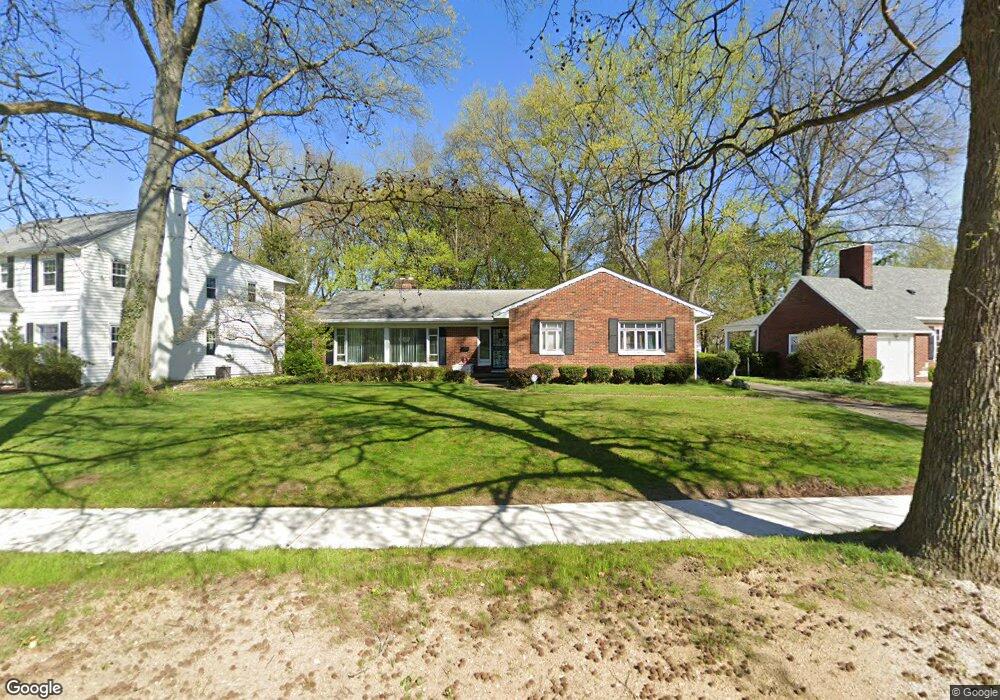
246 Elmdale Ave Akron, OH 44313
West Akron NeighborhoodEstimated Value: $240,000 - $283,000
3
Beds
2
Baths
1,940
Sq Ft
$137/Sq Ft
Est. Value
About This Home
This home is located at 246 Elmdale Ave, Akron, OH 44313 and is currently estimated at $266,453, approximately $137 per square foot. 246 Elmdale Ave is a home located in Summit County with nearby schools including Case Community Learning Center, Summit Academy School, and Our Lady Of The Elms Elementary School.
Ownership History
Date
Name
Owned For
Owner Type
Purchase Details
Closed on
Mar 13, 2024
Sold by
Morrison Vester L and Morrison Donna M
Bought by
Morrison Vester L
Current Estimated Value
Purchase Details
Closed on
May 19, 2014
Sold by
Morrison Vester L
Bought by
Morrison Vester L and Johnson Morrison Donna M
Purchase Details
Closed on
Oct 26, 2011
Sold by
Morrison Annie Lee and Williams Annie L
Bought by
Morrison Vester L
Purchase Details
Closed on
Apr 18, 2006
Sold by
Morrison Annie Lee
Bought by
Morrison Annie Lee and Morrison Vester L
Purchase Details
Closed on
May 24, 1996
Sold by
Sigalow Sam
Bought by
Morrison Annie L
Home Financials for this Owner
Home Financials are based on the most recent Mortgage that was taken out on this home.
Original Mortgage
$116,100
Interest Rate
8.1%
Mortgage Type
New Conventional
Create a Home Valuation Report for This Property
The Home Valuation Report is an in-depth analysis detailing your home's value as well as a comparison with similar homes in the area
Home Values in the Area
Average Home Value in this Area
Purchase History
| Date | Buyer | Sale Price | Title Company |
|---|---|---|---|
| Morrison Vester L | -- | None Listed On Document | |
| Morrison Vester L | -- | None Available | |
| Morrison Vester L | -- | Attorney | |
| Morrison Annie Lee | -- | None Available | |
| Morrison Annie L | $129,000 | -- |
Source: Public Records
Mortgage History
| Date | Status | Borrower | Loan Amount |
|---|---|---|---|
| Previous Owner | Morrison Annie L | $116,100 |
Source: Public Records
Tax History Compared to Growth
Tax History
| Year | Tax Paid | Tax Assessment Tax Assessment Total Assessment is a certain percentage of the fair market value that is determined by local assessors to be the total taxable value of land and additions on the property. | Land | Improvement |
|---|---|---|---|---|
| 2025 | $3,883 | $82,485 | $14,161 | $68,324 |
| 2024 | $3,883 | $82,485 | $14,161 | $68,324 |
| 2023 | $3,883 | $82,485 | $14,161 | $68,324 |
| 2022 | $3,405 | $59,024 | $10,115 | $48,909 |
| 2021 | $3,408 | $59,024 | $10,115 | $48,909 |
| 2020 | $3,357 | $59,030 | $10,120 | $48,910 |
| 2019 | $3,209 | $52,330 | $10,120 | $42,210 |
| 2018 | $3,166 | $52,330 | $10,120 | $42,210 |
| 2017 | $2,885 | $52,330 | $10,120 | $42,210 |
| 2016 | $2,887 | $47,640 | $10,120 | $37,520 |
| 2015 | $2,885 | $47,640 | $10,120 | $37,520 |
| 2014 | $2,862 | $47,640 | $10,120 | $37,520 |
| 2013 | $2,946 | $49,710 | $10,120 | $39,590 |
Source: Public Records
Map
Nearby Homes
- 1375 Jefferson Ave
- 0 S Hawkins Ave Unit 5162400
- 425 Orlando Ave
- S/L 39 W Sunset View Dr
- S/L 37 W Sunset View Dr
- S/L 38 W Sunset View Dr
- S/L 40 W Sunset View Dr
- 1450 Edgemoor Ave
- 325 Mineola Ave
- 1505 Marlowe Ave
- S/L 2 Sunrise View Dr
- S/L 3 Sunrise View Dr
- S/L 4 Sunrise View Dr
- 596 Mull Ave Unit 8
- 598 Mull Ave Unit 9
- 600 Mull Ave Unit 10
- S/L 5 Sunrise View Dr
- 604 Mull Ave Unit 12
- 602 Mull Ave Unit 11
- S/L 6 Sunrise View Dr
- 234 Elmdale Ave
- 421 Mull Ave
- 226 Elmdale Ave
- 391 Mull Ave
- 429 Mull Ave
- 435 Mull Ave
- 221 Elmdale Ave
- 214 Elmdale Ave
- 383 Mull Ave
- 441 Mull Ave
- 210 Elmdale Ave
- 269 Greenwood Ave
- 263 Greenwood Ave
- 377 Mull Ave
- 257 Greenwood Ave
- 1486 Jefferson Ave
- 1492 Jefferson Ave
- 275 Elmdale Ave
- 209 Elmdale Ave
- 251 Greenwood Ave