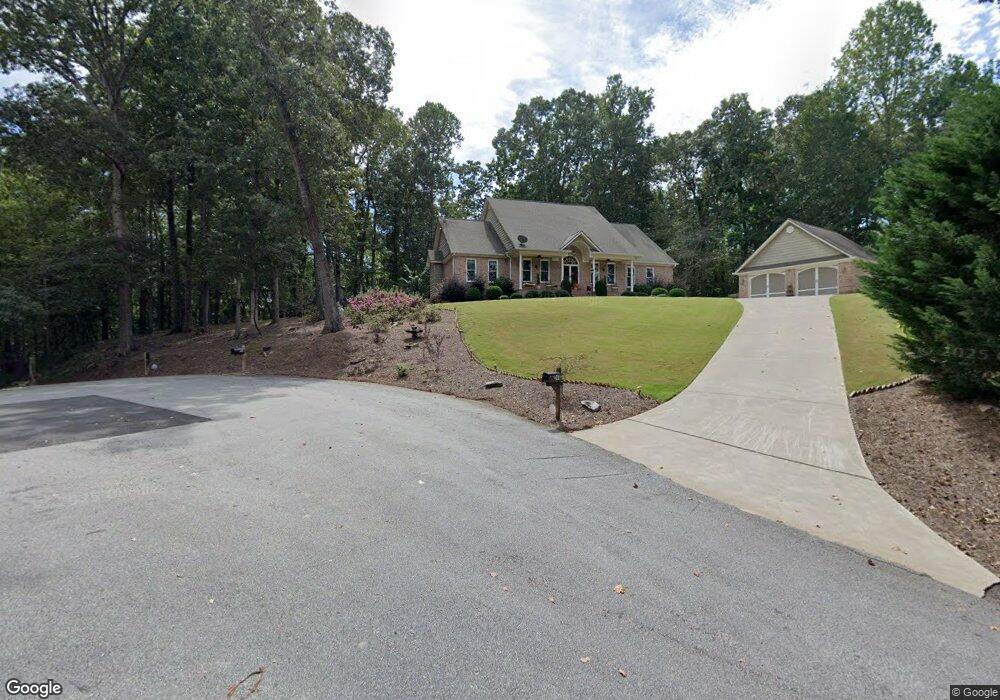
246 Hickory Nut Trail Dawsonville, GA 30534
Dawson County NeighborhoodEstimated Value: $631,386 - $870,000
3
Beds
2
Baths
2,633
Sq Ft
$274/Sq Ft
Est. Value
About This Home
This home is located at 246 Hickory Nut Trail, Dawsonville, GA 30534 and is currently estimated at $721,347, approximately $273 per square foot. 246 Hickory Nut Trail is a home located in Dawson County with nearby schools including Kilough Elementary School, Dawson County Junior High School, and Dawson County Middle School.
Ownership History
Date
Name
Owned For
Owner Type
Purchase Details
Closed on
Mar 8, 2024
Sold by
Satterfield James Timothy and Satterfield Cathy
Bought by
Jt And Cd Satterfield Family Revocable Living and Satterfield
Current Estimated Value
Purchase Details
Closed on
Jun 1, 2009
Sold by
Dahlonega Feed Poultry
Bought by
Leanella Lp
Purchase Details
Closed on
Feb 28, 2006
Sold by
Satterfield James T
Bought by
Satterfield James Timothy
Purchase Details
Closed on
Jan 5, 2006
Sold by
Not Provided
Bought by
Satterfield James Timothy and Satterfield Cathy
Purchase Details
Closed on
Jan 24, 2000
Sold by
Odom Larry
Bought by
Dahlonega Feed and Dahlonega Pou
Purchase Details
Closed on
Jan 27, 1994
Sold by
Estate Investments
Bought by
Odom Larry
Purchase Details
Closed on
Sep 27, 1991
Sold by
Carson E Howard
Bought by
Estate Investments
Purchase Details
Closed on
Sep 25, 1982
Sold by
Cochran John B
Bought by
Carson E Howard
Create a Home Valuation Report for This Property
The Home Valuation Report is an in-depth analysis detailing your home's value as well as a comparison with similar homes in the area
Home Values in the Area
Average Home Value in this Area
Purchase History
| Date | Buyer | Sale Price | Title Company |
|---|---|---|---|
| Jt And Cd Satterfield Family Revocable Living | -- | None Listed On Document | |
| Leanella Lp | -- | -- | |
| Satterfield James Timothy | -- | -- | |
| Satterfield James Timothy | $70,000 | -- | |
| Dahlonega Feed | $205,000 | -- | |
| Odom Larry | $8,500 | -- | |
| Estate Investments | -- | -- | |
| Carson E Howard | -- | -- |
Source: Public Records
Tax History Compared to Growth
Tax History
| Year | Tax Paid | Tax Assessment Tax Assessment Total Assessment is a certain percentage of the fair market value that is determined by local assessors to be the total taxable value of land and additions on the property. | Land | Improvement |
|---|---|---|---|---|
| 2024 | $3,272 | $204,280 | $30,600 | $173,680 |
| 2023 | $3,290 | $203,560 | $30,600 | $172,960 |
| 2022 | $3,207 | $151,720 | $18,000 | $133,720 |
| 2021 | $2,924 | $131,240 | $18,000 | $113,240 |
| 2020 | $2,960 | $127,080 | $18,000 | $109,080 |
| 2019 | $2,910 | $123,920 | $18,000 | $105,920 |
| 2018 | $2,916 | $123,920 | $18,000 | $105,920 |
| 2017 | $2,980 | $126,614 | $20,000 | $106,614 |
| 2016 | $2,884 | $122,571 | $20,000 | $102,571 |
| 2015 | $2,976 | $122,571 | $20,000 | $102,571 |
| 2014 | $2,831 | $113,108 | $20,000 | $93,108 |
| 2013 | -- | $94,841 | $16,000 | $78,841 |
Source: Public Records
Map
Nearby Homes
- 299 Landrum Rd
- 189 Scarlet Oak Ln
- 135 Scarlet Oak Ln
- 184 Scarlet Oak Ln
- 121 River Sound Alley
- 116 River Sound Alley
- 472 River Overlook Rd
- 230 E Harbor Dr
- 206 E Harbor Dr
- 194 E Harbor Dr
- 95 Ridgetop Ct
- 8083 Beachwood Dr
- 110 Peninsula Way
- 8070 Beachwood Dr
- 8079 Beachwood Dr
- 380 Fredericks Cove
- 25 River Sound Cir
- 202 Hickory Nut Trail
- 0 Hickory Bend Unit LOT 14 7309926
- 0 Hickory Bend Unit LOT 13 7309921
- 136 Hickory Nut Trail
- 229 Hickory Nut Trail
- 255 Hickory Nut Trail
- 245 Hickory Nut Trail
- 260 Hickory Nut Trail
- 239 Hickory Nut Trail
- 264 Hickory Nut Trail
- 13 Hickory Nut Trail
- 221 Hickory Nut Trail
- 114 Hickory Nut Trail
- 129 Hickory Nut Trail
- 105 Hickory Nut Trail
- 14 Hickory Nut Trail
- 8 Hickory Nut Trail
- 12 Hickory Nut Trail
- 40 Sourwood Cir
- 30 Sourwood Cir