Estimated Value: $396,633 - $598,000
3
Beds
2
Baths
1,852
Sq Ft
$265/Sq Ft
Est. Value
About This Home
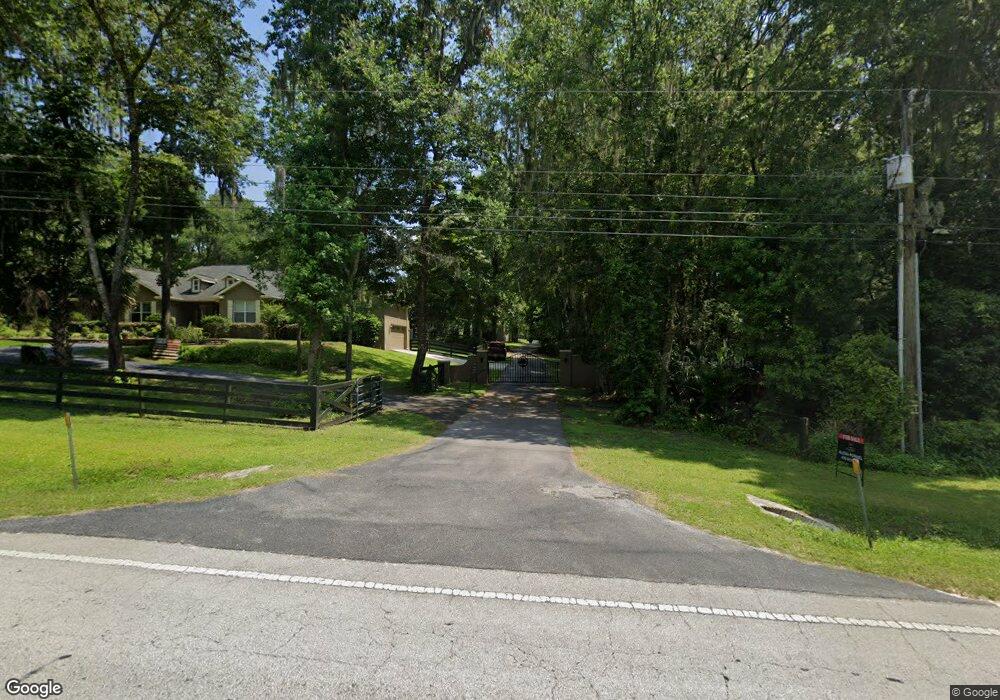
This home is located at 246 SE 95th St, Ocala, FL 34480 and is currently estimated at $491,658, approximately $265 per square foot. 246 SE 95th St is a home with nearby schools including Belleview-Santos Elementary School, Belleview Middle School, and Belleview High School.
Ownership History
Date
Name
Owned For
Owner Type
Purchase Details
Closed on
Sep 5, 2018
Sold by
Bontrager Andrea
Bought by
Blankenship Michael E and Blankenship Zandra R
Current Estimated Value
Home Financials for this Owner
Home Financials are based on the most recent Mortgage that was taken out on this home.
Original Mortgage
$123,500
Outstanding Balance
$107,046
Interest Rate
4.6%
Mortgage Type
New Conventional
Estimated Equity
$384,612
Purchase Details
Closed on
Jan 31, 2014
Sold by
Roberts Sara A
Bought by
Bontrager Clarence E and Bontrager Andrea
Purchase Details
Closed on
Nov 14, 2012
Sold by
Roberts Anthony D
Bought by
Roberts Sara A
Purchase Details
Closed on
Jan 19, 2012
Sold by
Suntrust Bank
Bought by
Roberts Anthony D and Roberts Sara A
Purchase Details
Closed on
Oct 17, 2011
Sold by
Fanek Sam B and Fanek Claudia C
Bought by
Suntrust Bank
Create a Home Valuation Report for This Property
The Home Valuation Report is an in-depth analysis detailing your home's value as well as a comparison with similar homes in the area
Home Values in the Area
Average Home Value in this Area
Purchase History
| Date | Buyer | Sale Price | Title Company |
|---|---|---|---|
| Blankenship Michael E | $130,000 | Equitable Title Of Ocala Llc | |
| Bontrager Clarence E | $28,000 | Stewart Title Company | |
| Roberts Sara A | -- | None Available | |
| Roberts Anthony D | $12,500 | Stewart Title Company | |
| Suntrust Bank | -- | None Available |
Source: Public Records
Mortgage History
| Date | Status | Borrower | Loan Amount |
|---|---|---|---|
| Open | Blankenship Michael E | $123,500 |
Source: Public Records
Tax History
| Year | Tax Paid | Tax Assessment Tax Assessment Total Assessment is a certain percentage of the fair market value that is determined by local assessors to be the total taxable value of land and additions on the property. | Land | Improvement |
|---|---|---|---|---|
| 2025 | $4,397 | $260,588 | -- | -- |
| 2024 | $3,922 | $253,244 | -- | -- |
| 2023 | $3,832 | $245,868 | $0 | $0 |
| 2022 | $3,737 | $238,707 | $0 | $0 |
| 2021 | $3,737 | $231,754 | $0 | $0 |
| 2020 | $1,273 | $57,863 | $37,230 | $20,633 |
| 2019 | $1,295 | $58,569 | $37,230 | $21,339 |
| 2018 | $1,001 | $43,363 | $21,930 | $21,433 |
| 2017 | $988 | $42,449 | $20,400 | $22,049 |
| 2016 | $951 | $40,938 | $0 | $0 |
| 2015 | $458 | $26,123 | $0 | $0 |
| 2014 | $342 | $20,156 | $0 | $0 |
Source: Public Records
Map
Nearby Homes
- 9605 S Magnolia Ave
- 0 SW 98th Ln
- 255 SW 96th Ln
- 1154 SE 95th St
- 750 SW 91st Place
- 9095 SW 9th Terrace
- 363 SE 90th St
- 0 Tbd Sw 104th Street Rd
- 1401 SE 91st Place
- 9096 SE 7th Avenue Rd
- TBD SW 9th Terrace
- 8549 S Magnolia Ave
- 9389 SW 14th Ave
- 555 SW 87th Place
- 0 SW 104th St Unit 22934395
- 8950 SE 17th Ct
- 901 SW 87th Place
- 8325 SW 3rd Ct
- 1815 SE 89th Ln
- 1198 SW 104th Street Rd
- 250 SE 95th St
- 270 SE 95th St
- 320 SE 95th St
- 232 SE 95th St
- 282 SE 95th St
- 282 SE 95th St
- 220 SE 95th St
- 456 SE 95th St
- 9475 S Magnolia Ave
- 516 SE 95th St
- 586 SE 95th St
- 501 SE 95th St
- 85 SE 95th St
- 0 S Highway 475 Unit MFROM435203
- 0 S Highway 475 Unit OM627693
- 0 S Highway 475 Unit OM397291
- 0 S Highway 475 Unit OM397294
- 0 S Highway 475 Unit OM391253
- 0 S Highway 475 Unit OM374296
- 0 S Highway 475 Unit OM364150
Your Personal Tour Guide
Ask me questions while you tour the home.