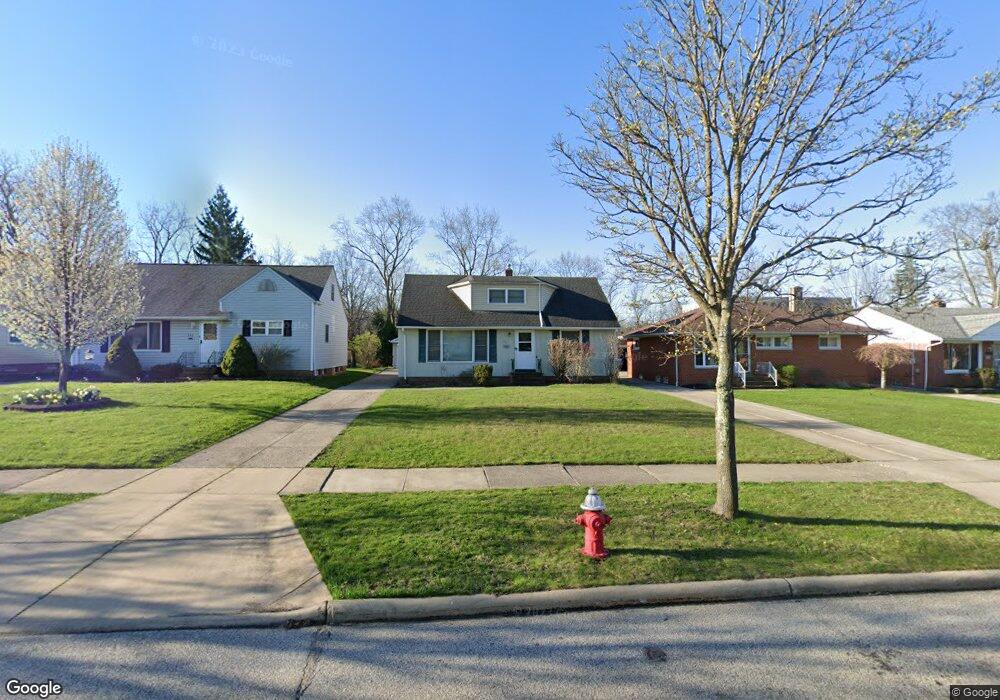
246 Talbot Dr Bedford, OH 44146
Estimated Value: $120,000 - $204,000
4
Beds
2
Baths
1,426
Sq Ft
$116/Sq Ft
Est. Value
About This Home
This home is located at 246 Talbot Dr, Bedford, OH 44146 and is currently estimated at $164,925, approximately $115 per square foot. 246 Talbot Dr is a home located in Cuyahoga County with nearby schools including Heskett Middle School, Bedford High School, and Ohio College Preparatory School.
Ownership History
Date
Name
Owned For
Owner Type
Purchase Details
Closed on
Sep 16, 2009
Sold by
Angyal Eric A and Zassick Kathleen F
Bought by
Tripp Ii Marvin R and Tripp Latoya M
Current Estimated Value
Home Financials for this Owner
Home Financials are based on the most recent Mortgage that was taken out on this home.
Original Mortgage
$96,715
Outstanding Balance
$63,668
Interest Rate
5.32%
Mortgage Type
FHA
Estimated Equity
$101,257
Purchase Details
Closed on
Mar 28, 1997
Sold by
Brackley Mary R
Bought by
Angyal Eric A
Home Financials for this Owner
Home Financials are based on the most recent Mortgage that was taken out on this home.
Original Mortgage
$67,500
Interest Rate
7.73%
Mortgage Type
New Conventional
Purchase Details
Closed on
Aug 28, 1980
Sold by
Brackley James F and Brackley Mary K
Bought by
Brackley Mary K
Purchase Details
Closed on
Jan 1, 1975
Bought by
Brackley James F and Brackley Mary K
Create a Home Valuation Report for This Property
The Home Valuation Report is an in-depth analysis detailing your home's value as well as a comparison with similar homes in the area
Home Values in the Area
Average Home Value in this Area
Purchase History
| Date | Buyer | Sale Price | Title Company |
|---|---|---|---|
| Tripp Ii Marvin R | $98,500 | Attorney | |
| Angyal Eric A | $84,500 | -- | |
| Brackley Mary K | -- | -- | |
| Brackley James F | -- | -- |
Source: Public Records
Mortgage History
| Date | Status | Borrower | Loan Amount |
|---|---|---|---|
| Open | Tripp Ii Marvin R | $96,715 | |
| Closed | Angyal Eric A | $67,500 |
Source: Public Records
Tax History
| Year | Tax Paid | Tax Assessment Tax Assessment Total Assessment is a certain percentage of the fair market value that is determined by local assessors to be the total taxable value of land and additions on the property. | Land | Improvement |
|---|---|---|---|---|
| 2024 | $3,777 | $49,105 | $9,555 | $39,550 |
| 2023 | $3,742 | $42,150 | $9,210 | $32,940 |
| 2022 | $3,305 | $42,140 | $9,210 | $32,940 |
| 2021 | $3,222 | $42,140 | $9,210 | $32,940 |
| 2020 | $3,228 | $37,980 | $8,300 | $29,680 |
| 2019 | $3,144 | $108,500 | $23,700 | $84,800 |
| 2018 | $3,112 | $37,980 | $8,300 | $29,680 |
| 2017 | $2,384 | $26,890 | $5,570 | $21,320 |
| 2016 | $2,364 | $26,890 | $5,570 | $21,320 |
| 2015 | $2,183 | $26,890 | $5,570 | $21,320 |
| 2014 | $2,183 | $26,890 | $5,570 | $21,320 |
Source: Public Records
Map
Nearby Homes
Your Personal Tour Guide
Ask me questions while you tour the home.