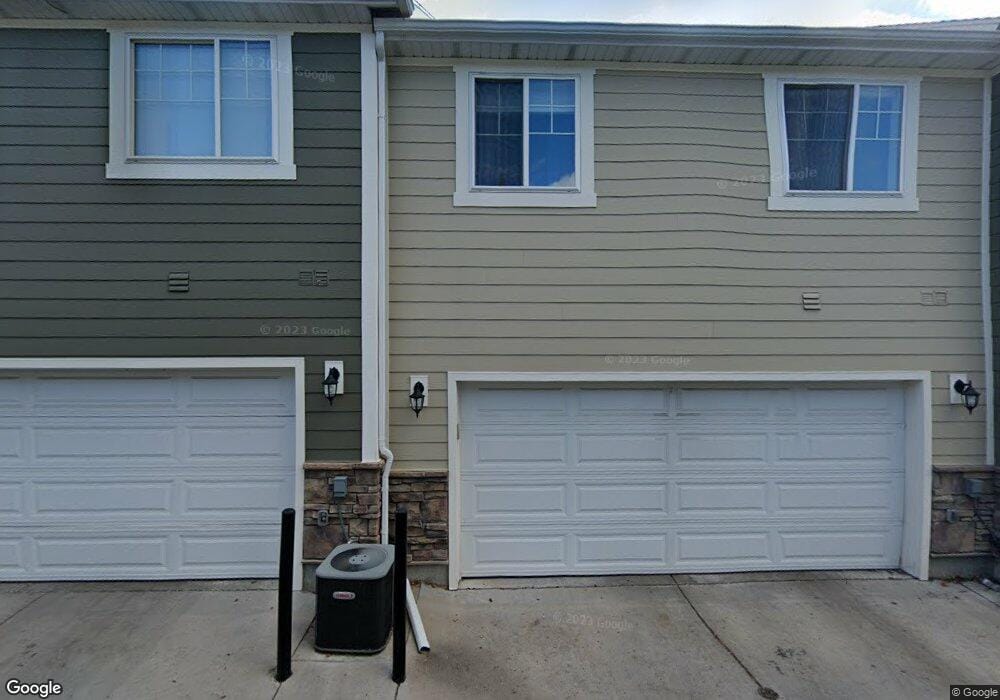
246 W 1010 S Logan, UT 84321
Woodruff NeighborhoodEstimated Value: $281,929 - $321,000
3
Beds
3
Baths
1,302
Sq Ft
$236/Sq Ft
Est. Value
About This Home
This home is located at 246 W 1010 S, Logan, UT 84321 and is currently estimated at $307,732, approximately $236 per square foot. 246 W 1010 S is a home located in Cache County with nearby schools including Hillcrest Elementary School, Mount Logan Middle School, and Logan High School.
Ownership History
Date
Name
Owned For
Owner Type
Purchase Details
Closed on
Dec 28, 2020
Sold by
Am Shakespear Properties Llc
Bought by
Smith Monicalynn and Smith Eric P
Current Estimated Value
Home Financials for this Owner
Home Financials are based on the most recent Mortgage that was taken out on this home.
Original Mortgage
$210,123
Outstanding Balance
$186,980
Interest Rate
2.8%
Mortgage Type
FHA
Estimated Equity
$120,752
Purchase Details
Closed on
Oct 30, 2012
Sold by
Drd Holdings Llc
Bought by
Am Shakespear Properties Llc
Purchase Details
Closed on
Oct 28, 2010
Sold by
Rivercrossing Town Homes Llc
Bought by
Drd Holdings Llc
Home Financials for this Owner
Home Financials are based on the most recent Mortgage that was taken out on this home.
Original Mortgage
$525,000
Interest Rate
4.27%
Mortgage Type
Future Advance Clause Open End Mortgage
Create a Home Valuation Report for This Property
The Home Valuation Report is an in-depth analysis detailing your home's value as well as a comparison with similar homes in the area
Home Values in the Area
Average Home Value in this Area
Purchase History
| Date | Buyer | Sale Price | Title Company |
|---|---|---|---|
| Smith Monicalynn | -- | American Secure Title Logan | |
| Am Shakespear Properties Llc | -- | Pinnacle Title Ins Agency | |
| Drd Holdings Llc | -- | Pinnacle Title Ins Agency |
Source: Public Records
Mortgage History
| Date | Status | Borrower | Loan Amount |
|---|---|---|---|
| Open | Smith Monicalynn | $210,123 | |
| Previous Owner | Drd Holdings Llc | $525,000 |
Source: Public Records
Tax History
| Year | Tax Paid | Tax Assessment Tax Assessment Total Assessment is a certain percentage of the fair market value that is determined by local assessors to be the total taxable value of land and additions on the property. | Land | Improvement |
|---|---|---|---|---|
| 2025 | $119 | $154,410 | $0 | $0 |
| 2024 | $1,353 | $169,475 | $0 | $0 |
| 2023 | $1,503 | $179,465 | $0 | $0 |
| 2022 | $1,671 | $186,340 | $0 | $0 |
| 2021 | $1,098 | $189,062 | $38,000 | $151,062 |
| 2020 | $1,092 | $169,359 | $38,000 | $131,359 |
| 2019 | $1,142 | $169,359 | $38,000 | $131,359 |
| 2018 | $1,147 | $155,285 | $38,000 | $117,285 |
| 2017 | $1,076 | $77,055 | $0 | $0 |
| 2016 | $1,116 | $71,940 | $0 | $0 |
| 2015 | $1,022 | $70,535 | $0 | $0 |
| 2014 | $924 | $70,535 | $0 | $0 |
| 2013 | -- | $70,535 | $0 | $0 |
Source: Public Records
Map
Nearby Homes
Your Personal Tour Guide
Ask me questions while you tour the home.