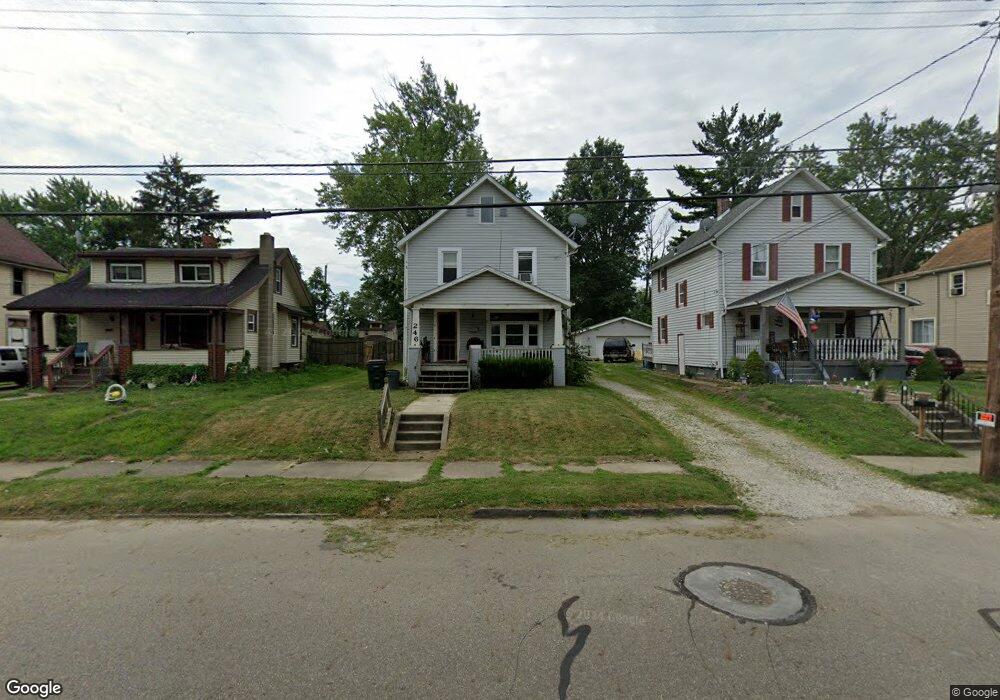
246 W Vine St Alliance, OH 44601
Estimated Value: $82,004 - $95,000
3
Beds
1
Bath
1,144
Sq Ft
$78/Sq Ft
Est. Value
About This Home
This home is located at 246 W Vine St, Alliance, OH 44601 and is currently estimated at $89,001, approximately $77 per square foot. 246 W Vine St is a home located in Stark County with nearby schools including Alliance Early Learning School, Alliance Intermediate School at Northside, and Alliance Middle School.
Ownership History
Date
Name
Owned For
Owner Type
Purchase Details
Closed on
Feb 20, 2018
Sold by
Pnc Mortgage
Bought by
Dalesandro Jerry A
Current Estimated Value
Purchase Details
Closed on
Jun 20, 2017
Sold by
Appleby Jennie L
Bought by
Pnc Mortgage
Purchase Details
Closed on
Apr 24, 2017
Sold by
Appleby Jennie L
Bought by
Pnc Bank Na
Purchase Details
Closed on
Feb 15, 2002
Sold by
Miller Erma B
Bought by
Appleby Jennie L
Home Financials for this Owner
Home Financials are based on the most recent Mortgage that was taken out on this home.
Original Mortgage
$49,129
Interest Rate
7.14%
Mortgage Type
Purchase Money Mortgage
Purchase Details
Closed on
Mar 21, 1994
Purchase Details
Closed on
Jul 13, 1992
Create a Home Valuation Report for This Property
The Home Valuation Report is an in-depth analysis detailing your home's value as well as a comparison with similar homes in the area
Home Values in the Area
Average Home Value in this Area
Purchase History
| Date | Buyer | Sale Price | Title Company |
|---|---|---|---|
| Dalesandro Jerry A | $18,000 | Nationallink Reo | |
| Pnc Mortgage | $28,000 | None Available | |
| Pnc Bank Na | $28,000 | None Available | |
| Appleby Jennie L | $49,900 | -- | |
| -- | $21,700 | -- | |
| -- | $12,400 | -- |
Source: Public Records
Mortgage History
| Date | Status | Borrower | Loan Amount |
|---|---|---|---|
| Previous Owner | Appleby Jennie L | $49,129 |
Source: Public Records
Tax History Compared to Growth
Tax History
| Year | Tax Paid | Tax Assessment Tax Assessment Total Assessment is a certain percentage of the fair market value that is determined by local assessors to be the total taxable value of land and additions on the property. | Land | Improvement |
|---|---|---|---|---|
| 2025 | -- | $19,290 | $4,730 | $14,560 |
| 2024 | -- | $19,290 | $4,730 | $14,560 |
| 2023 | $657 | $15,960 | $4,690 | $11,270 |
| 2022 | $661 | $15,960 | $4,690 | $11,270 |
| 2021 | $663 | $15,960 | $4,690 | $11,270 |
| 2020 | $604 | $13,580 | $4,060 | $9,520 |
| 2019 | $596 | $13,580 | $4,060 | $9,520 |
| 2018 | $599 | $13,580 | $4,060 | $9,520 |
| 2017 | $446 | $9,240 | $2,730 | $6,510 |
| 2016 | $450 | $9,940 | $2,730 | $7,210 |
| 2015 | $377 | $9,240 | $2,730 | $6,510 |
| 2014 | $425 | $9,910 | $2,940 | $6,970 |
| 2013 | $212 | $9,910 | $2,940 | $6,970 |
Source: Public Records
Map
Nearby Homes
- 124 E Wayne St
- 710 N Freedom Ave
- 511 W Ely St
- 000 Meadowbrook Ave
- 0 Meadowbrook Ave
- 329 1/2 W Main St
- 11344 Walnut Ave NE
- 163 W Market St
- 345 W Market St
- 0 Homestead Ave NE
- 132 S Haines Ave
- 432 Johnson Ave
- 14723 Bolton St NE
- 0 Johnson Ave NE Unit 5142926
- 652 N Webb Ave
- 361 E Main St
- 11680 Walnut Ave NE
- 000 Klinger Ave
- 11310 Webb Ave NE
- 427 S Union Ave