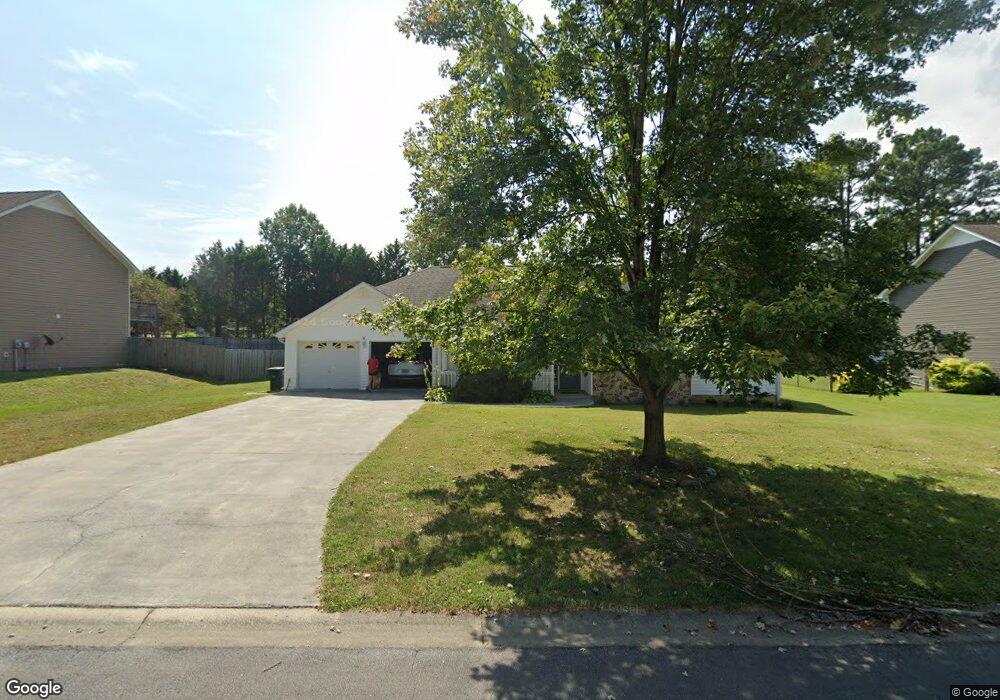
246 Wildwood Cir SE Calhoun, GA 30701
Estimated Value: $292,000 - $313,000
3
Beds
2
Baths
1,818
Sq Ft
$166/Sq Ft
Est. Value
About This Home
This home is located at 246 Wildwood Cir SE, Calhoun, GA 30701 and is currently estimated at $300,900, approximately $165 per square foot. 246 Wildwood Cir SE is a home located in Gordon County with nearby schools including Calhoun Primary School, Calhoun Elementary School, and Calhoun Middle School.
Ownership History
Date
Name
Owned For
Owner Type
Purchase Details
Closed on
Dec 20, 2011
Sold by
Johnson Katherine E
Bought by
Johnson Katherine E and Johnson William B
Current Estimated Value
Home Financials for this Owner
Home Financials are based on the most recent Mortgage that was taken out on this home.
Original Mortgage
$114,000
Outstanding Balance
$78,208
Interest Rate
4.07%
Mortgage Type
New Conventional
Estimated Equity
$222,692
Purchase Details
Closed on
Apr 30, 2003
Sold by
Johnson Brenda G
Bought by
Johnson Katherine E
Purchase Details
Closed on
Sep 14, 2000
Sold by
Wilson Frank A and Wilson Shirley
Bought by
Johnson Brenda G
Purchase Details
Closed on
Mar 16, 1999
Bought by
Wilson Frank A and Wilson Shirley
Purchase Details
Closed on
Jan 13, 1999
Bought by
Cronon Beatrice J
Purchase Details
Closed on
Oct 1, 1998
Bought by
Oothalooga Lllp
Create a Home Valuation Report for This Property
The Home Valuation Report is an in-depth analysis detailing your home's value as well as a comparison with similar homes in the area
Home Values in the Area
Average Home Value in this Area
Purchase History
| Date | Buyer | Sale Price | Title Company |
|---|---|---|---|
| Johnson Katherine E | -- | -- | |
| Johnson Katherine E | $130,000 | -- | |
| Johnson Brenda G | $127,500 | -- | |
| Wilson Frank A | $116,900 | -- | |
| Cronon Beatrice J | -- | -- | |
| Oothalooga Lllp | -- | -- |
Source: Public Records
Mortgage History
| Date | Status | Borrower | Loan Amount |
|---|---|---|---|
| Open | Johnson Katherine E | $114,000 |
Source: Public Records
Tax History Compared to Growth
Tax History
| Year | Tax Paid | Tax Assessment Tax Assessment Total Assessment is a certain percentage of the fair market value that is determined by local assessors to be the total taxable value of land and additions on the property. | Land | Improvement |
|---|---|---|---|---|
| 2024 | $2,423 | $86,820 | $5,600 | $81,220 |
| 2023 | $2,260 | $81,024 | $5,600 | $75,424 |
| 2022 | $701 | $75,668 | $5,600 | $70,068 |
| 2021 | $1,822 | $61,840 | $5,600 | $56,240 |
| 2020 | $1,763 | $59,396 | $5,320 | $54,076 |
| 2019 | $1,760 | $59,396 | $5,320 | $54,076 |
| 2018 | $509 | $54,856 | $5,320 | $49,536 |
| 2017 | $491 | $51,976 | $5,320 | $46,656 |
| 2016 | $411 | $43,740 | $4,480 | $39,260 |
| 2015 | $382 | $40,252 | $4,200 | $36,052 |
| 2014 | $360 | $38,513 | $4,200 | $34,313 |
Source: Public Records
Map
Nearby Homes
- 200 Wildwood Cir SE
- 114 Vinings Way SE
- 107 Savoy Place SE
- 62 Professional Place Unit 30
- 220 Lenox Rd SE
- 209 Willowbrook Dr SE
- 119 Deer Park Ln
- 112 Willowbrook Dr SE
- 402 Linda Ln
- 199 Cherry St SE
- 104 Bobwhite Dr
- 195 Dogwood Dr SE
- The Pearson Plan at Creekview
- The Coleman Plan at Creekview
- The Benson II Plan at Creekview
- The Piedmont Plan at Creekview
- The Harrington Plan at Creekview
- The McGinnis Plan at Creekview
- The Caldwell Plan at Creekview
- 107 Bobwhite Dr
- 242 Wildwood Cir SE
- 181 Honeysuckle Dr SE
- 173 Honeysuckle Dr SE
- 238 Wildwood Cir SE
- 189 Honeysuckle Dr SE
- 0 Honeysuckle Dr SE Unit 8826890
- 0 Honeysuckle Dr SE Unit 8808112
- 0 Honeysuckle Dr SE
- 247 Wildwood Cir SE
- 251 Wildwood Cir SE
- 167 Honeysuckle Dr SE
- 243 Wildwood Cir SE
- 255 Wildwood Cir SE
- 234 Wildwood Cir SE
- 195 Honeysuckle Dr SE
- 239 Wildwood Cir SE
- 260 Wildwood Cir SE
- 159 Honeysuckle Dr SE
- 257 Wildwood Cir SE
- 180 Honeysuckle Dr SE