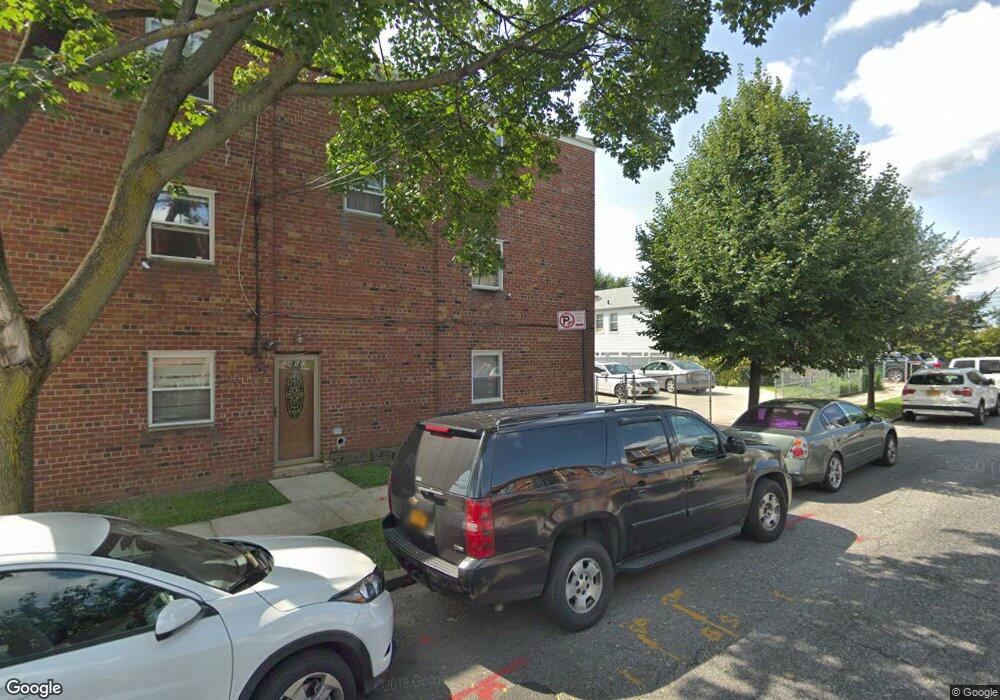
2460 81st St East Elmhurst, NY 11370
Jackson Heights NeighborhoodEstimated Value: $1,240,000 - $1,460,000
--
Bed
--
Bath
2,400
Sq Ft
$551/Sq Ft
Est. Value
About This Home
This home is located at 2460 81st St, East Elmhurst, NY 11370 and is currently estimated at $1,322,000, approximately $550 per square foot. 2460 81st St is a home located in Queens County with nearby schools including P.S. 2 Alfred Zimberg, Is 141 The Steinway, and William Cullen Bryant High School.
Ownership History
Date
Name
Owned For
Owner Type
Purchase Details
Closed on
Jan 2, 2002
Sold by
Andruk Vivian
Bought by
Andruk Steven and Andruk Patricia
Current Estimated Value
Purchase Details
Closed on
Dec 20, 2001
Sold by
Andruk Vivian
Bought by
Andruk Steven and Andruk Patricia
Purchase Details
Closed on
Dec 15, 1999
Sold by
Andruk Vivian and Andruk Mathew
Bought by
Andruk Vivian
Purchase Details
Closed on
Jan 4, 1999
Sold by
Andruk Vivian
Bought by
Andruk Steven and Andruk Patricia
Purchase Details
Closed on
Dec 21, 1998
Sold by
Andruk Vivian
Bought by
Andruk Steven and Andruk Patricia
Purchase Details
Closed on
Jan 2, 1997
Sold by
Andruk Mathew
Bought by
Andruk Steven and Andruk Patricia
Purchase Details
Closed on
Dec 7, 1996
Sold by
Andruk Mathew and Andruk Vivian
Bought by
Andruk Mathew and Andruk Vivian
Create a Home Valuation Report for This Property
The Home Valuation Report is an in-depth analysis detailing your home's value as well as a comparison with similar homes in the area
Home Values in the Area
Average Home Value in this Area
Purchase History
| Date | Buyer | Sale Price | Title Company |
|---|---|---|---|
| Andruk Steven | -- | -- | |
| Andruk Steven | -- | -- | |
| Andruk Steven | -- | -- | |
| Andruk Steven | -- | -- | |
| Andruk Vivian | -- | Chicago Title | |
| Andruk Vivian | -- | Chicago Title | |
| Andruk Steven | -- | Chicago Title | |
| Andruk Steven | -- | Chicago Title | |
| Andruk Steven | -- | Chicago Title | |
| Andruk Steven | -- | Chicago Title | |
| Andruk Steven | -- | Chicago Title Insurance Co | |
| Andruk Steven | -- | -- | |
| Andruk Steven | -- | Chicago Title Insurance Co | |
| Andruk Mathew | -- | Chicago Title Ins Co | |
| Andruk Mathew | -- | Chicago Title Ins Co |
Source: Public Records
Tax History Compared to Growth
Tax History
| Year | Tax Paid | Tax Assessment Tax Assessment Total Assessment is a certain percentage of the fair market value that is determined by local assessors to be the total taxable value of land and additions on the property. | Land | Improvement |
|---|---|---|---|---|
| 2025 | $11,158 | $56,402 | $7,936 | $48,466 |
| 2024 | $11,158 | $55,555 | $7,707 | $47,848 |
| 2023 | $10,725 | $52,808 | $8,058 | $44,750 |
| 2022 | $9,946 | $66,000 | $10,080 | $55,920 |
| 2021 | $9,892 | $61,440 | $10,080 | $51,360 |
| 2020 | $9,949 | $67,560 | $10,080 | $57,480 |
| 2019 | $9,685 | $62,220 | $10,080 | $52,140 |
| 2018 | $8,971 | $44,007 | $7,590 | $36,417 |
| 2017 | $8,463 | $41,517 | $8,393 | $33,124 |
| 2016 | $7,830 | $41,517 | $8,393 | $33,124 |
| 2015 | $4,724 | $39,168 | $8,777 | $30,391 |
| 2014 | $4,724 | $38,580 | $10,380 | $28,200 |
Source: Public Records
Map
Nearby Homes