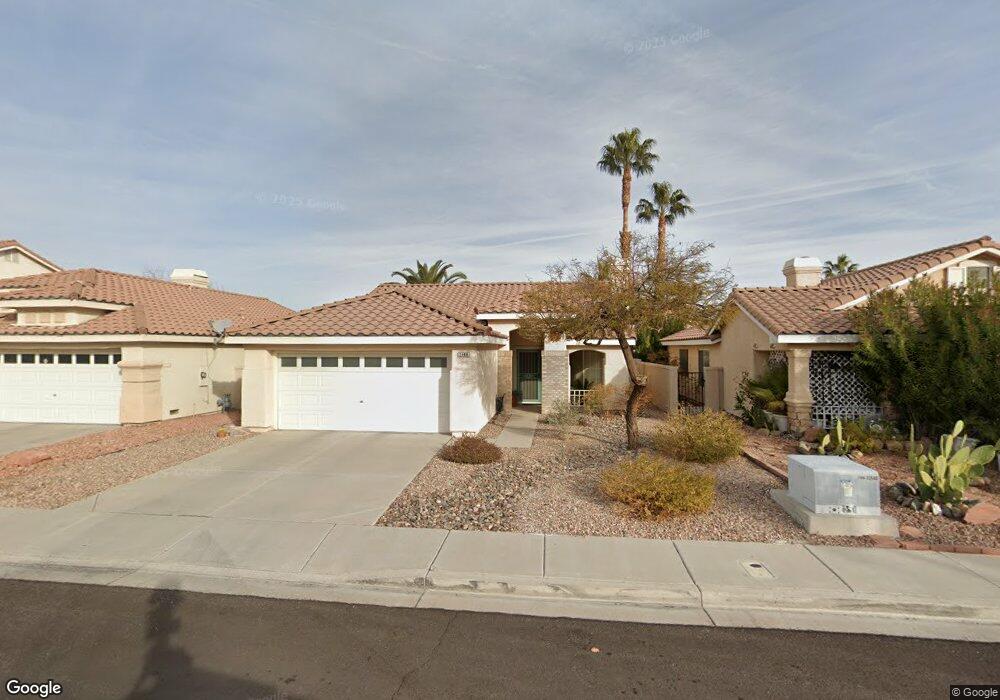
2460 Via de Cortona Henderson, NV 89074
Green Valley South NeighborhoodEstimated Value: $369,953 - $425,000
3
Beds
2
Baths
998
Sq Ft
$398/Sq Ft
Est. Value
About This Home
This home is located at 2460 Via de Cortona, Henderson, NV 89074 and is currently estimated at $396,988, approximately $397 per square foot. 2460 Via de Cortona is a home located in Clark County with nearby schools including John Vanderburg Elementary School, Neil C. Twitchell Elementary School, and Bob Miller Middle School.
Ownership History
Date
Name
Owned For
Owner Type
Purchase Details
Closed on
Nov 4, 2019
Sold by
Nath Kimberly Ann
Bought by
Nath Kimberly Ann and Kimberly Ann Nath Living Revocable Trust
Current Estimated Value
Purchase Details
Closed on
May 7, 2018
Sold by
Nath Kimberly
Bought by
Nath Kimberly Ann and The Kimberly Ann Rampa Living Revocable
Purchase Details
Closed on
Jan 23, 1995
Sold by
Nath Steven and Nath Kimberly
Bought by
Nath Kimberly
Home Financials for this Owner
Home Financials are based on the most recent Mortgage that was taken out on this home.
Original Mortgage
$11,234
Interest Rate
9.28%
Purchase Details
Closed on
Mar 30, 1994
Sold by
Kaufman & Broad Nevada Inc
Bought by
Nath Steven and Nath Kimberly
Home Financials for this Owner
Home Financials are based on the most recent Mortgage that was taken out on this home.
Original Mortgage
$86,750
Interest Rate
7.15%
Create a Home Valuation Report for This Property
The Home Valuation Report is an in-depth analysis detailing your home's value as well as a comparison with similar homes in the area
Home Values in the Area
Average Home Value in this Area
Purchase History
| Date | Buyer | Sale Price | Title Company |
|---|---|---|---|
| Nath Kimberly Ann | -- | None Available | |
| Nath Kimberly Ann | -- | None Available | |
| Nath Kimberly | -- | First American Title Company | |
| Nath Steven | $96,500 | First American Title Company |
Source: Public Records
Mortgage History
| Date | Status | Borrower | Loan Amount |
|---|---|---|---|
| Closed | Nath Kimberly | $11,234 | |
| Closed | Nath Steven | $86,750 |
Source: Public Records
Tax History Compared to Growth
Tax History
| Year | Tax Paid | Tax Assessment Tax Assessment Total Assessment is a certain percentage of the fair market value that is determined by local assessors to be the total taxable value of land and additions on the property. | Land | Improvement |
|---|---|---|---|---|
| 2025 | $1,333 | $77,459 | $37,100 | $40,359 |
| 2024 | $1,294 | $77,459 | $37,100 | $40,359 |
| 2023 | $1,294 | $70,720 | $32,375 | $38,345 |
| 2022 | $1,257 | $63,216 | $28,000 | $35,216 |
| 2021 | $1,220 | $58,279 | $24,500 | $33,779 |
| 2020 | $1,182 | $57,701 | $24,150 | $33,551 |
| 2019 | $1,147 | $53,405 | $20,300 | $33,105 |
| 2018 | $1,114 | $47,172 | $17,150 | $30,022 |
| 2017 | $1,382 | $47,667 | $17,150 | $30,517 |
| 2016 | $1,056 | $42,363 | $11,550 | $30,813 |
| 2015 | $1,053 | $40,689 | $10,150 | $30,539 |
| 2014 | $1,022 | $35,739 | $8,050 | $27,689 |
Source: Public Records
Map
Nearby Homes
- 2494 Via di Autostrada
- 37 Bishopsgate Terrace
- 2427 Worchester Rd
- 2505 Cortina Ave
- 6 High Sierra Dr
- 2412 Eagleridge Dr
- 58 Pleasant Dale Dr
- 36 Tidwell Ln
- 2458 Tour Edition Dr
- 107 Tapatio St Unit 83
- 2561 Diplomacy Pointe Ct
- 247 Integrity Ridge Dr
- 43 Fantasia Ln
- 126 Montclair Dr
- 124 Tapatio St
- 112 Wynntry Dr
- 2802 Camelback Ln
- 2201 Ramsgate Dr Unit 1127
- 2201 Ramsgate Dr Unit 923
- 2201 Ramsgate Dr Unit 816
- 2458 Via de Cortona
- 2462 Via de Cortona
- 2464 Via de Cortona
- 2464 Via de Cortona Unit n/a
- 2456 Via de Cortona
- 2461 Via de Milano
- 2459 Via de Milano
- 2463 Via de Milano
- 2465 Via de Milano
- 2457 Via de Milano
- 2466 Via de Cortona
- 2461 Via de Cortona
- 2459 Via de Cortona
- 2463 Via de Cortona
- 2467 Via de Milano
- 2457 Via de Cortona
- 2465 Via de Cortona
- 2468 Via de Cortona
- 2469 Via de Milano