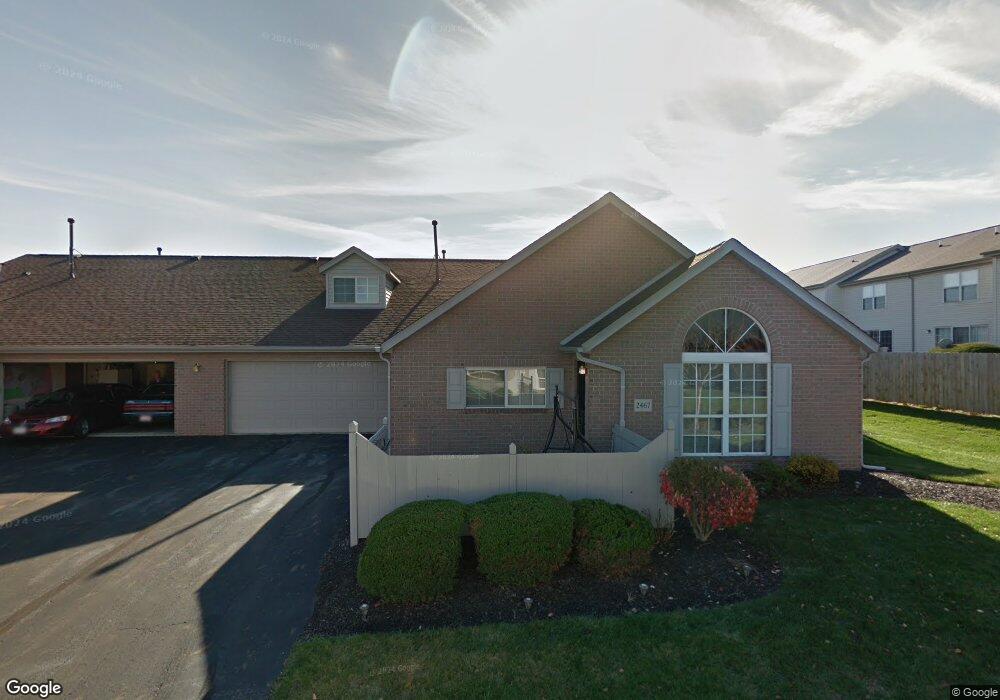
2461 Meadow Glade Dr Unit 2461 Hilliard, OH 43026
Hilliard Green NeighborhoodEstimated Value: $298,000 - $332,000
3
Beds
3
Baths
1,600
Sq Ft
$194/Sq Ft
Est. Value
About This Home
This home is located at 2461 Meadow Glade Dr Unit 2461, Hilliard, OH 43026 and is currently estimated at $310,724, approximately $194 per square foot. 2461 Meadow Glade Dr Unit 2461 is a home located in Franklin County with nearby schools including J W Reason Elementary School, Hilliard Station Sixth Grade Elementary School, and Hilliard Heritage Middle School.
Ownership History
Date
Name
Owned For
Owner Type
Purchase Details
Closed on
Mar 15, 2022
Sold by
Garey Patrick A
Bought by
Garey Patrick A and Garey Gloria G
Current Estimated Value
Purchase Details
Closed on
Mar 8, 2022
Sold by
Garey Patrick A
Bought by
Garey Patrick A and Garey Gloria G
Purchase Details
Closed on
Jun 4, 2021
Sold by
Garey Patrick A and Daniel H Garey Living Trust
Bought by
Garey Patrick A
Purchase Details
Closed on
Jun 3, 2021
Sold by
Daniel H Garey Living Trust and Garey Patrick A
Bought by
Garey Patrick A
Purchase Details
Closed on
Jul 12, 2005
Sold by
Garey Daniel H
Bought by
Garey Daniel H and Daniel H Garey Living Trust
Purchase Details
Closed on
Oct 30, 2003
Sold by
Garey Lorena M
Bought by
Garey Daniel H
Purchase Details
Closed on
Oct 25, 2002
Sold by
Dawson James P and Dawson Terri L
Bought by
Garey Daniel H
Create a Home Valuation Report for This Property
The Home Valuation Report is an in-depth analysis detailing your home's value as well as a comparison with similar homes in the area
Home Values in the Area
Average Home Value in this Area
Purchase History
| Date | Buyer | Sale Price | Title Company |
|---|---|---|---|
| Garey Patrick A | -- | Hendrix Robert S | |
| Garey Patrick A | -- | Hendrix Robert S | |
| Garey Patrick A | -- | None Available | |
| Garey Patrick A | -- | None Listed On Document | |
| Garey Daniel H | -- | -- | |
| Garey Daniel H | -- | -- | |
| Garey Daniel H | $152,000 | Independent Title |
Source: Public Records
Tax History Compared to Growth
Tax History
| Year | Tax Paid | Tax Assessment Tax Assessment Total Assessment is a certain percentage of the fair market value that is determined by local assessors to be the total taxable value of land and additions on the property. | Land | Improvement |
|---|---|---|---|---|
| 2024 | $7,197 | $86,950 | $15,930 | $71,020 |
| 2023 | $4,361 | $86,940 | $15,925 | $71,015 |
| 2022 | $4,106 | $65,520 | $8,190 | $57,330 |
| 2021 | $4,102 | $65,520 | $8,190 | $57,330 |
| 2020 | $3,456 | $65,520 | $8,190 | $57,330 |
| 2019 | $2,969 | $50,400 | $6,300 | $44,100 |
| 2018 | $1,478 | $50,400 | $6,300 | $44,100 |
| 2017 | $2,957 | $50,400 | $6,300 | $44,100 |
| 2016 | $2,654 | $43,370 | $6,760 | $36,610 |
| 2015 | $1,243 | $43,370 | $6,760 | $36,610 |
| 2014 | $2,492 | $43,370 | $6,760 | $36,610 |
| 2013 | $1,262 | $43,365 | $6,755 | $36,610 |
Source: Public Records
Map
Nearby Homes
- 2464 Meadow Glade Dr Unit 2464
- 4997 Meadow Run Dr Unit 4997
- 5106 Gredle Dr
- 4955 Baycroft Dr
- 4969 Hilliard Green Dr
- 2401 Featherwood Dr
- 2477 Crystal Springs Dr
- 5052 Bressler Dr
- 5112 Bressler Dr
- 2378 Myrtle Valley Dr
- 5215 Bressler Dr
- 2673 Bramble Dr
- 4976 Shady Oak Dr
- 2759 Lyndley Ct
- 4995 Singleton Dr
- 4995 Singleton Dr Unit 18c
- 0 Hillard Road St Unit 225040295
- 5258 Skytrail Dr
- 5503 Nike Dr
- 5559 Fescue Dr
- 2467 Meadow Glade Dr Unit 2467
- 2463 Meadow Glade Dr Unit 2463
- 2465 Meadow Glade Dr Unit 2465
- 2455 Meadow Glade Dr Unit 2455
- 2471 Meadow Glade Dr Unit 2471
- 2473 Meadow Glade Dr Unit 2473
- 2460 Meadow Glade Dr Unit 2460
- 2466 Meadow Glade Dr Unit 2466
- 2456 Meadow Glade Dr Unit 2456
- 2477 Meadow Glade Dr
- 2475 Meadow Glade Dr Unit 2475
- 2470 Meadow Glade Dr Unit 2470
- 2462 Meadow Glade Dr Unit 2462
- 5000 Baycroft Dr
- 2476 Meadow Glade Dr Unit 2476
- 2454 Meadow Glade Dr Unit 2454
- 2472 Meadow Glade Dr Unit 2472
- 5064 Gredle Dr
- 4994 Baycroft Dr