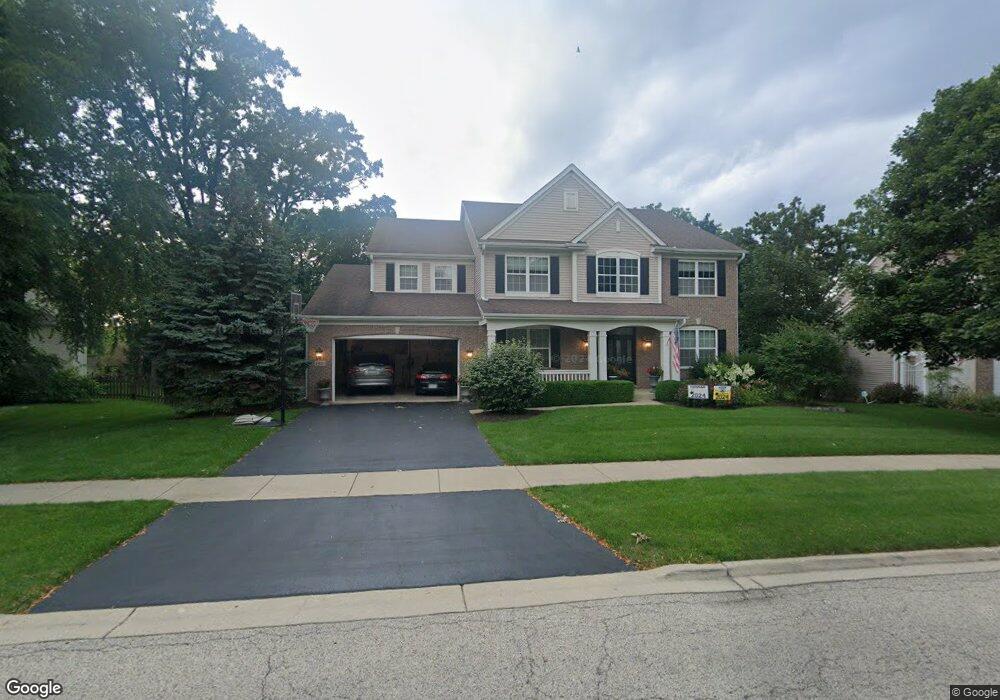
2461 Savanna Dr Unit 1B Wauconda, IL 60084
Estimated Value: $601,999 - $749,000
4
Beds
4
Baths
4,300
Sq Ft
$152/Sq Ft
Est. Value
About This Home
This home is located at 2461 Savanna Dr Unit 1B, Wauconda, IL 60084 and is currently estimated at $654,000, approximately $152 per square foot. 2461 Savanna Dr Unit 1B is a home located in Lake County with nearby schools including Robert Crown School, Wauconda Middle School, and Wauconda High School.
Ownership History
Date
Name
Owned For
Owner Type
Purchase Details
Closed on
Sep 16, 2020
Sold by
Werner John
Bought by
Werner John and Werner Jamie M
Current Estimated Value
Purchase Details
Closed on
Aug 25, 2011
Sold by
Federal National Mortgage Association
Bought by
Werner John
Home Financials for this Owner
Home Financials are based on the most recent Mortgage that was taken out on this home.
Original Mortgage
$267,900
Outstanding Balance
$185,663
Interest Rate
4.59%
Mortgage Type
New Conventional
Estimated Equity
$468,337
Purchase Details
Closed on
Mar 30, 2011
Sold by
Butler Matthew
Bought by
Federal National Mortgage Association
Purchase Details
Closed on
Jan 18, 2006
Sold by
Pinnacle Corp
Bought by
Butler Matthew D and Butler Jacquelyn D
Home Financials for this Owner
Home Financials are based on the most recent Mortgage that was taken out on this home.
Original Mortgage
$417,000
Interest Rate
6.2%
Mortgage Type
Fannie Mae Freddie Mac
Create a Home Valuation Report for This Property
The Home Valuation Report is an in-depth analysis detailing your home's value as well as a comparison with similar homes in the area
Home Values in the Area
Average Home Value in this Area
Purchase History
| Date | Buyer | Sale Price | Title Company |
|---|---|---|---|
| Werner John | -- | Janus Title Agency Llc | |
| Werner John | $282,000 | Attorneys Title Guaranty Fun | |
| Federal National Mortgage Association | -- | None Available | |
| Butler Matthew D | $526,000 | Chicago Title Insurance Co |
Source: Public Records
Mortgage History
| Date | Status | Borrower | Loan Amount |
|---|---|---|---|
| Open | Werner John | $267,900 | |
| Previous Owner | Butler Matthew D | $417,000 |
Source: Public Records
Tax History Compared to Growth
Tax History
| Year | Tax Paid | Tax Assessment Tax Assessment Total Assessment is a certain percentage of the fair market value that is determined by local assessors to be the total taxable value of land and additions on the property. | Land | Improvement |
|---|---|---|---|---|
| 2024 | $15,544 | $169,277 | $33,457 | $135,820 |
| 2023 | $16,907 | $154,732 | $30,582 | $124,150 |
| 2022 | $16,907 | $150,742 | $31,378 | $119,364 |
| 2021 | $16,202 | $142,437 | $29,649 | $112,788 |
| 2020 | $15,741 | $135,758 | $28,259 | $107,499 |
| 2019 | $14,103 | $128,303 | $26,707 | $101,596 |
| 2018 | $15,324 | $131,274 | $40,029 | $91,245 |
| 2017 | $15,175 | $129,756 | $39,566 | $90,190 |
| 2016 | $14,324 | $122,875 | $37,468 | $85,407 |
| 2015 | $12,537 | $112,801 | $34,396 | $78,405 |
| 2014 | $9,613 | $88,715 | $32,051 | $56,664 |
| 2012 | $9,351 | $88,332 | $32,630 | $55,702 |
Source: Public Records
Map
Nearby Homes
- 2227 Trailside Ln Unit 1B
- 2460 Savanna Dr
- 2511 Bluewater Dr Unit 1A
- 29650 N Garland Rd
- 2810 Cattail Ct Unit B
- 2800 Cattail Ct Unit A
- 2820 Glacier Way Unit B
- 2800 Sweet Clover Way
- 29564 N Garland Rd
- 2490 Olivia Ct
- 2486 Olivia Ct
- 2472 Olivia Ct
- 2483 Olivia Ct
- 2403 Goldenrod Way
- 29295 N Callahan Rd
- 28855 N Garland Rd
- 2373 Heron Ln
- 24570 W Chardon Rd
- 28722 N Madison Ave
- 0 Bonner Rd
- 2481 Savanna Dr
- 2441 Savanna Dr
- 2232 Trailside Ln Unit 1B
- 2234 Trailside Ln
- 2230 Trailside Ln Unit 1B
- 2501 Savanna Dr
- 2421 Savanna Dr
- 2236 Trailside Ln Unit 1B
- 2440 Savanna Dr Unit 1B
- 2480 Savanna Dr
- 2420 Savanna Dr
- 2238 Trailside Ln Unit 1B
- 2231 Trailside Ln Unit 1B
- 2400 Savanna Dr Unit 1B
- 2229 Trailside Ln Unit 1B
- 2361 Savanna Dr Unit 1B
- 2225 Trailside Ln Unit 1B
- 2223 Trailside Ln Unit 1B
- 2380 Savanna Dr
- 2221 Trailside Ln