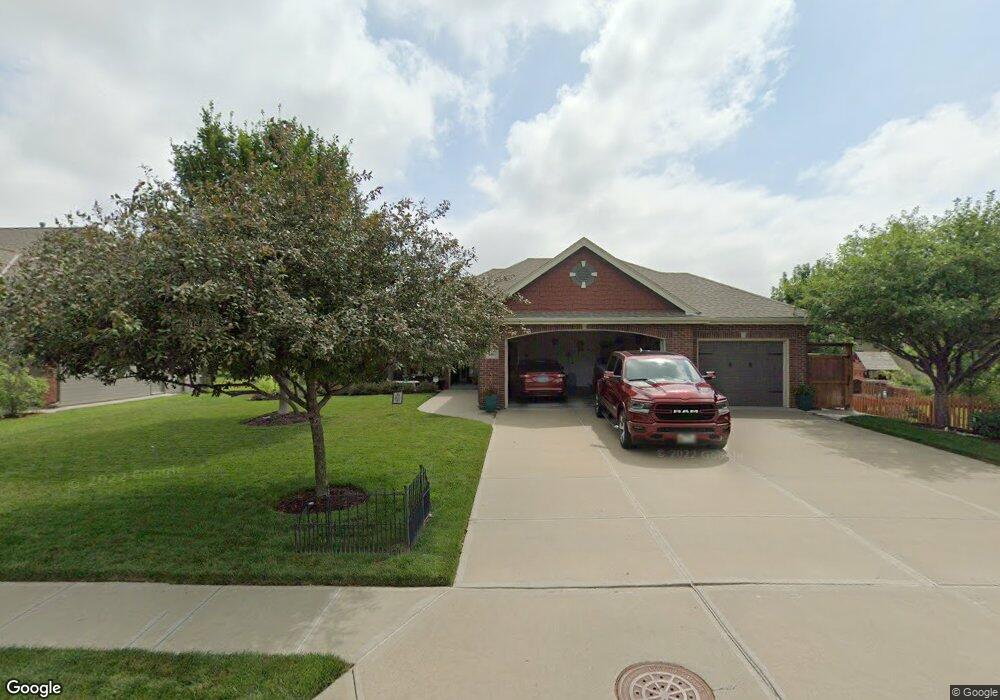
2461 Stillwater Dr Papillion, NE 68046
Estimated Value: $428,000 - $527,537
3
Beds
5
Baths
1,982
Sq Ft
$251/Sq Ft
Est. Value
About This Home
This home is located at 2461 Stillwater Dr, Papillion, NE 68046 and is currently estimated at $498,384, approximately $251 per square foot. 2461 Stillwater Dr is a home located in Sarpy County with nearby schools including Patriot Elementary School, Liberty Middle School, and Papillion La Vista South High School.
Ownership History
Date
Name
Owned For
Owner Type
Purchase Details
Closed on
Dec 22, 2023
Sold by
Grzywa Richard T
Bought by
Richard T Grzywa Revocable Trust and Grzywa
Current Estimated Value
Purchase Details
Closed on
Jun 20, 2007
Sold by
Belt Construction Co Inc
Bought by
Grzywa Richard T and Grzywa Gail M
Home Financials for this Owner
Home Financials are based on the most recent Mortgage that was taken out on this home.
Original Mortgage
$232,000
Interest Rate
6.19%
Purchase Details
Closed on
Jan 14, 2005
Sold by
Savanna Shores Llc
Bought by
Belt Construction Co Inc
Home Financials for this Owner
Home Financials are based on the most recent Mortgage that was taken out on this home.
Original Mortgage
$64,950
Interest Rate
5.85%
Mortgage Type
Small Business Administration
Create a Home Valuation Report for This Property
The Home Valuation Report is an in-depth analysis detailing your home's value as well as a comparison with similar homes in the area
Home Values in the Area
Average Home Value in this Area
Purchase History
| Date | Buyer | Sale Price | Title Company |
|---|---|---|---|
| Richard T Grzywa Revocable Trust | -- | None Listed On Document | |
| Grzywa Richard T | $313,000 | Ots | |
| Belt Construction Co Inc | $65,000 | Clean Title & Escrow Llc |
Source: Public Records
Mortgage History
| Date | Status | Borrower | Loan Amount |
|---|---|---|---|
| Previous Owner | Grzywa Richard T | $232,000 | |
| Previous Owner | Belt Construction Co Inc | $64,950 |
Source: Public Records
Tax History Compared to Growth
Tax History
| Year | Tax Paid | Tax Assessment Tax Assessment Total Assessment is a certain percentage of the fair market value that is determined by local assessors to be the total taxable value of land and additions on the property. | Land | Improvement |
|---|---|---|---|---|
| 2025 | $9,701 | $499,315 | $83,000 | $416,315 |
| 2024 | $11,184 | $479,867 | $80,000 | $399,867 |
| 2023 | $11,184 | $458,449 | $75,000 | $383,449 |
| 2022 | $10,395 | $396,917 | $70,000 | $326,917 |
| 2021 | $10,292 | $379,950 | $61,000 | $318,950 |
| 2020 | $9,968 | $368,426 | $60,000 | $308,426 |
| 2019 | $9,749 | $363,644 | $60,000 | $303,644 |
| 2018 | $9,369 | $348,485 | $60,000 | $288,485 |
| 2017 | $9,075 | $337,858 | $52,000 | $285,858 |
| 2016 | $7,798 | $290,082 | $52,000 | $238,082 |
| 2015 | $8,000 | $297,937 | $65,000 | $232,937 |
| 2014 | $7,704 | $286,086 | $61,000 | $225,086 |
| 2012 | -- | $285,948 | $61,000 | $224,948 |
Source: Public Records
Map
Nearby Homes
- 2404 Walnut Creek Dr
- 2231 Crystal Creek Dr
- 2070 Stillwater Dr
- 2241 Glacier Dr
- 2105 Petersen Dr
- 2421 Sand Hills Dr
- 2010 Ridgeview Dr
- 2110 S Mineral Dr
- 1806 Walnut Creek Dr
- 12001 S 90th St
- Lot 115 Ave Unit Lot 115
- 1010 Clearwater Dr
- 8904 Legacy St
- 1808 Southview Dr
- 12318 S 89th Ave Unit Lot 118
- 12314 S 89th Ave Unit Lot 119
- 12358 S 89th Ave Unit Lot 116
- 12354 S 89th Ave Unit Lot 117
- 12418 S 89th Ave Unit Lot 110
- 12504 S 89th Ave Unit Lot 107
- 2471 Stillwater Dr
- 2451 Stillwater Dr
- 1410 Hardwood Dr
- 1380 Hardwood Dr
- 2431 Stillwater Dr
- 1410 Ranch Cir
- 1430 Hardwood Dr
- 1370 Hardwood Dr
- 2421 Stillwater Dr
- 1360 Hardwood Dr
- 1420 Ranch Cir
- 1440 Hardwood Dr
- 1411 Hardwood Dr
- 1381 Hardwood Dr
- 1421 Hardwood Dr
- 1411 Ranch Cir
- 1371 Hardwood Dr
- 2411 Stillwater Dr
- 1431 Hardwood Dr
- 1450 Hardwood Dr