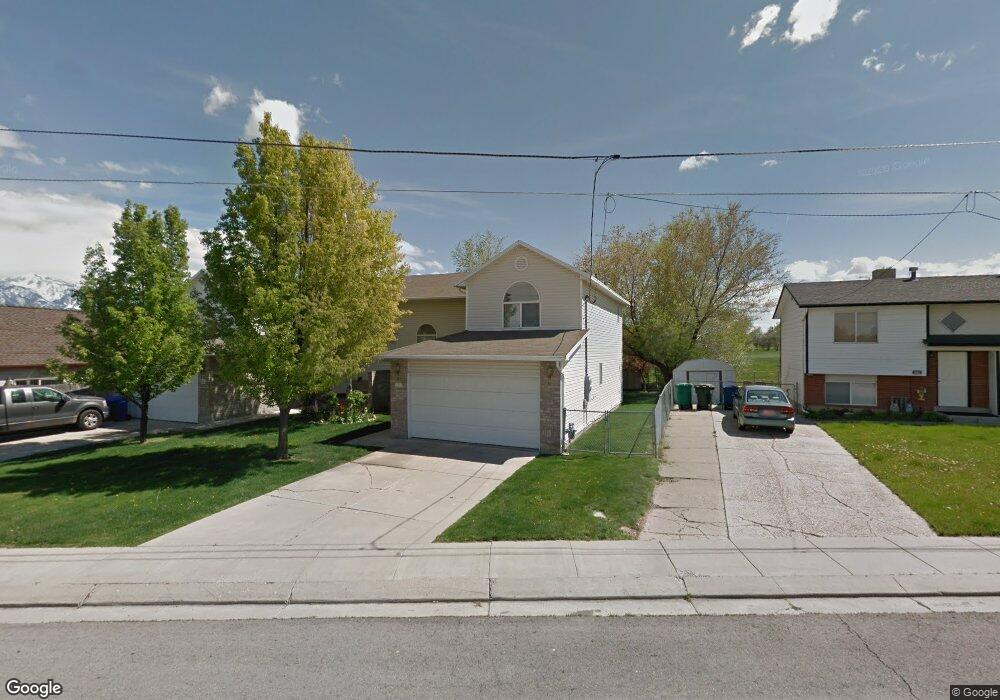
2461 Sugar Factory Rd West Jordan, UT 84088
Edenbrooke NeighborhoodEstimated Value: $382,000 - $779,000
6
Beds
6
Baths
2,742
Sq Ft
$181/Sq Ft
Est. Value
About This Home
This home is located at 2461 Sugar Factory Rd, West Jordan, UT 84088 and is currently estimated at $496,324, approximately $181 per square foot. 2461 Sugar Factory Rd is a home located in Salt Lake County with nearby schools including Westvale Elementary School, West Jordan Middle School, and West Jordan High School.
Ownership History
Date
Name
Owned For
Owner Type
Purchase Details
Closed on
Jul 15, 2015
Sold by
Dennison Richard and Dennison Shonna
Bought by
Dennison Holdings Llc 2453 Sugar Factory
Current Estimated Value
Purchase Details
Closed on
Apr 30, 2002
Sold by
Glade Travis J and Glade Kati J
Bought by
Dennison Richard and Dennison Shonna
Purchase Details
Closed on
Jul 12, 2000
Sold by
Glade Travis J and Glade Kati J
Bought by
Glade Travis J and Glade Kati J
Purchase Details
Closed on
Jul 6, 1999
Sold by
Powell Scott and Powell Brenda
Bought by
Glade Travis J and Glade Kati J
Home Financials for this Owner
Home Financials are based on the most recent Mortgage that was taken out on this home.
Original Mortgage
$198,000
Interest Rate
7.24%
Purchase Details
Closed on
Jun 14, 1996
Sold by
Powell Brenda
Bought by
Powell Scott
Home Financials for this Owner
Home Financials are based on the most recent Mortgage that was taken out on this home.
Original Mortgage
$122,200
Interest Rate
8.25%
Create a Home Valuation Report for This Property
The Home Valuation Report is an in-depth analysis detailing your home's value as well as a comparison with similar homes in the area
Home Values in the Area
Average Home Value in this Area
Purchase History
| Date | Buyer | Sale Price | Title Company |
|---|---|---|---|
| Dennison Holdings Llc 2453 Sugar Factory | -- | None Available | |
| Dennison Richard | -- | Merrill Title | |
| Glade Travis J | -- | -- | |
| Glade Travis J | -- | -- | |
| Powell Scott | -- | -- |
Source: Public Records
Mortgage History
| Date | Status | Borrower | Loan Amount |
|---|---|---|---|
| Previous Owner | Glade Travis J | $198,000 | |
| Previous Owner | Powell Scott | $122,200 |
Source: Public Records
Tax History Compared to Growth
Tax History
| Year | Tax Paid | Tax Assessment Tax Assessment Total Assessment is a certain percentage of the fair market value that is determined by local assessors to be the total taxable value of land and additions on the property. | Land | Improvement |
|---|---|---|---|---|
| 2025 | $1,971 | $413,800 | $156,300 | $257,500 |
| 2024 | $1,971 | $379,200 | $144,200 | $235,000 |
| 2023 | $2,002 | $363,000 | $136,000 | $227,000 |
| 2022 | $2,081 | $371,300 | $133,300 | $238,000 |
| 2021 | $1,759 | $285,600 | $107,500 | $178,100 |
| 2020 | $1,641 | $250,100 | $107,500 | $142,600 |
| 2019 | $1,559 | $233,000 | $107,500 | $125,500 |
| 2018 | $0 | $215,900 | $78,900 | $137,000 |
| 2017 | $1,351 | $199,400 | $78,900 | $120,500 |
| 2016 | $2,223 | $308,200 | $71,700 | $236,500 |
| 2015 | $1,631 | $220,500 | $75,100 | $145,400 |
| 2014 | $1,498 | $199,400 | $69,600 | $129,800 |
Source: Public Records
Map
Nearby Homes
- 48 San Rafael Ct
- 77 Rio Bravo Place
- 8461 S 2385 W
- 14 San Miguel St
- 8383 S 2200 W
- 2497 Bueno Vista Dr
- 8140 S 2245 W
- 3542 W Franco Ct Unit 4
- 4000 W 8400 S Unit 83
- 8026 Laguna Cir
- 7968 S 2700 W
- 7993 S 2760 W
- 8407 Meadow Green Way
- 7942 S 2800 W
- 3112 Green Acre Dr
- 7987 S 2980 W
- 8886 S 2700 W
- 1790 W Sugar Factory Rd
- 8493 S 3200 W
- 8859 S Long Dr
- 2453 W Sugar Factory Rd
- 2467 Sugar Factory Rd Unit 2473
- 2445 Sugar Factory Rd
- 2445 W Sugar Factory Rd
- 2437 W Sugar Factory Rd
- 2437 Sugar Factory Rd
- 2483 Sugar Factory Rd Unit 2487
- 2429 Sugar Factory Rd
- 2429 W Sugar Factory Rd
- 2497 Sugar Factory Rd Unit 2501
- 2421 Sugar Factory Rd
- 8313 W Garden Creek Ct
- 2407 Sugar Factory Rd
- 8301 W Garden Creek Ct
- 8306 W Garden Creek Ct
- 2511 W Sugar Factory Rd
- 2511 Sugar Factory Rd Unit 2515
- 2471 Garden Creek Way
- 2471 W Garden Creek Way
- 2395 Sugar Factory Rd