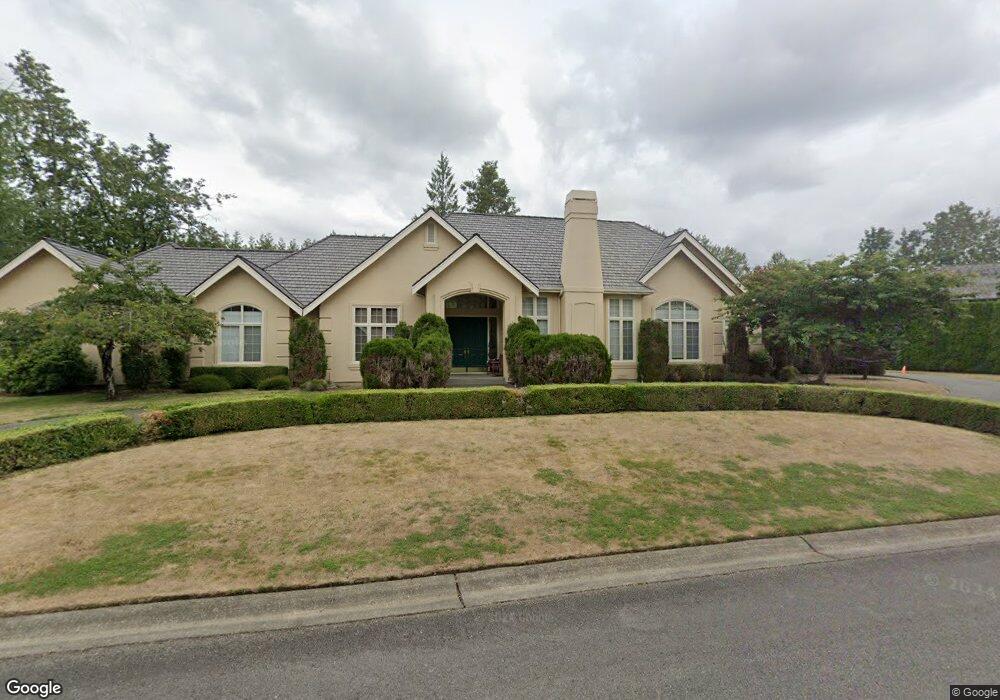
24613 SE 9th Place Sammamish, WA 98074
Estimated Value: $3,179,000 - $3,621,000
4
Beds
4
Baths
5,110
Sq Ft
$661/Sq Ft
Est. Value
About This Home
This home is located at 24613 SE 9th Place, Sammamish, WA 98074 and is currently estimated at $3,376,902, approximately $660 per square foot. 24613 SE 9th Place is a home located in King County with nearby schools including Discovery Elementary School, Beaver Lake Middle School, and Skyline High School.
Ownership History
Date
Name
Owned For
Owner Type
Purchase Details
Closed on
Oct 31, 2002
Sold by
Demichillie L Greg and Demichillie Pamelia A
Bought by
Zhang Li and Li Iris Hong Yan
Current Estimated Value
Home Financials for this Owner
Home Financials are based on the most recent Mortgage that was taken out on this home.
Original Mortgage
$650,000
Outstanding Balance
$234,700
Interest Rate
4.15%
Estimated Equity
$3,142,202
Purchase Details
Closed on
Jul 30, 1999
Sold by
Rumold Bill and Rumold Connie
Bought by
Demichillie L Greg and Demichillie Pamela A
Purchase Details
Closed on
Nov 16, 1998
Sold by
Steven D Smith Construction Inc
Bought by
Rumold Bill and Rumold Connie
Home Financials for this Owner
Home Financials are based on the most recent Mortgage that was taken out on this home.
Original Mortgage
$600,000
Interest Rate
6.69%
Create a Home Valuation Report for This Property
The Home Valuation Report is an in-depth analysis detailing your home's value as well as a comparison with similar homes in the area
Home Values in the Area
Average Home Value in this Area
Purchase History
| Date | Buyer | Sale Price | Title Company |
|---|---|---|---|
| Zhang Li | $1,150,000 | Chicago Title | |
| Demichillie L Greg | $1,325,000 | Chicago Title Insurance Co | |
| Rumold Bill | $1,150,000 | Chicago Title Insurance Co |
Source: Public Records
Mortgage History
| Date | Status | Borrower | Loan Amount |
|---|---|---|---|
| Open | Zhang Li | $650,000 | |
| Previous Owner | Rumold Bill | $600,000 |
Source: Public Records
Tax History Compared to Growth
Tax History
| Year | Tax Paid | Tax Assessment Tax Assessment Total Assessment is a certain percentage of the fair market value that is determined by local assessors to be the total taxable value of land and additions on the property. | Land | Improvement |
|---|---|---|---|---|
| 2024 | $4,991 | $3,042,000 | $992,000 | $2,050,000 |
| 2023 | $4,628 | $2,638,000 | $871,000 | $1,767,000 |
| 2022 | $26,582 | $3,353,000 | $1,120,000 | $2,233,000 |
| 2021 | $23,838 | $2,670,000 | $801,000 | $1,869,000 |
| 2020 | $23,032 | $2,210,000 | $667,000 | $1,543,000 |
| 2018 | $20,606 | $2,112,000 | $665,000 | $1,447,000 |
| 2017 | $17,602 | $1,865,000 | $595,000 | $1,270,000 |
| 2016 | $16,766 | $1,632,000 | $525,000 | $1,107,000 |
| 2015 | $16,395 | $1,532,000 | $525,000 | $1,007,000 |
| 2014 | -- | $1,477,000 | $512,000 | $965,000 |
| 2013 | -- | $1,279,000 | $466,000 | $813,000 |
Source: Public Records
Map
Nearby Homes
- 24241 SE 10th Place
- 723 241st Ln SE
- 24036 SE 10th Ct
- 710 240th Way SE Unit J302
- 710 240th Way SE Unit G201
- 24004 SE 10th Ct
- 538 241st Ln SE
- 535 241st Ln SE
- 24930 SE 17th St Unit 3
- 320 238th Ave SE
- 24907 SE 21st Place
- 2258 250th Place SE
- 2016 236th Ave SE
- 25417 NE 3rd Place
- 1505 231st Ave SE
- 124 259th Ave NE
- 22926 SE 13th Way
- 260 XX SE 18th Place
- 2615 E Beaver Lake Dr SE
- 22773 SE 14th Ct Unit 10
- 24605 SE 9th Place
- 24637 SE 9th Place
- 24614 SE 9th Place
- 24622 SE 9th Place
- 24601 SE 9th Place
- 24606 SE 9th Place
- 24671 SE 9th Place
- 24634 SE 9th Place
- 24733 SE Windsor Blvd
- 24521 SE Windsor Blvd
- 24646 SE 9th Place
- 24516 SE Windsor Blvd
- 24 SE 9th Place
- 24652 SE 9th Place
- 24658 SE 9th Place
- 24668 SE 9th Place
- 24672 SE 9th Place
- 24674 SE 9th Place
- 916 SE 24th Ct SE
- 24730 SE Windsor Blvd