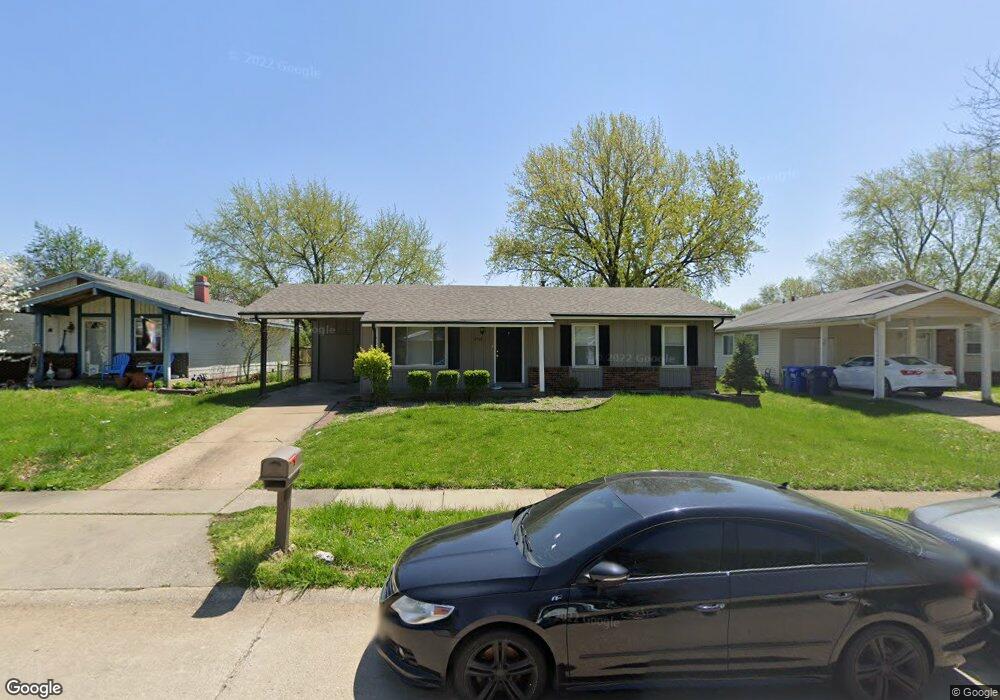
2462 Soundview Ct Florissant, MO 63031
Estimated Value: $123,000 - $199,000
3
Beds
1
Bath
960
Sq Ft
$168/Sq Ft
Est. Value
About This Home
This home is located at 2462 Soundview Ct, Florissant, MO 63031 and is currently estimated at $161,138, approximately $167 per square foot. 2462 Soundview Ct is a home located in St. Louis County with nearby schools including Lawson Elementary School, West Middle School, and Hazelwood West High School.
Ownership History
Date
Name
Owned For
Owner Type
Purchase Details
Closed on
Oct 29, 2020
Sold by
Alfano Michael P
Bought by
Revocable Living Trust Agreement Of Michael P and Alfano
Current Estimated Value
Purchase Details
Closed on
Dec 6, 2010
Sold by
Hsbc Bank Usa N A
Bought by
Alfano Michael P
Purchase Details
Closed on
Oct 21, 2010
Sold by
Johnston Edward
Bought by
Hsbc Bank Usa N A
Purchase Details
Closed on
Jul 15, 2004
Sold by
Updegraff Charles W and Updegraff Christianne
Bought by
Johnston Edward
Home Financials for this Owner
Home Financials are based on the most recent Mortgage that was taken out on this home.
Original Mortgage
$88,500
Interest Rate
6.3%
Mortgage Type
New Conventional
Create a Home Valuation Report for This Property
The Home Valuation Report is an in-depth analysis detailing your home's value as well as a comparison with similar homes in the area
Home Values in the Area
Average Home Value in this Area
Purchase History
| Date | Buyer | Sale Price | Title Company |
|---|---|---|---|
| Revocable Living Trust Agreement Of Michael P | -- | None Listed On Document | |
| Revocable Living Trust Agreement Of Michael P | -- | None Listed On Document | |
| Alfano Michael P | $37,100 | Mokan | |
| Hsbc Bank Usa N A | $94,000 | None Available | |
| Johnston Edward | $93,500 | Affordable Title Services In |
Source: Public Records
Mortgage History
| Date | Status | Borrower | Loan Amount |
|---|---|---|---|
| Previous Owner | Johnston Edward | $88,500 |
Source: Public Records
Tax History Compared to Growth
Tax History
| Year | Tax Paid | Tax Assessment Tax Assessment Total Assessment is a certain percentage of the fair market value that is determined by local assessors to be the total taxable value of land and additions on the property. | Land | Improvement |
|---|---|---|---|---|
| 2025 | $2,003 | $25,770 | $5,040 | $20,730 |
| 2024 | $2,003 | $22,280 | $3,360 | $18,920 |
| 2023 | $2,003 | $22,280 | $3,360 | $18,920 |
| 2022 | $1,890 | $18,760 | $3,860 | $14,900 |
| 2021 | $1,841 | $18,760 | $3,860 | $14,900 |
| 2020 | $1,649 | $15,810 | $3,360 | $12,450 |
| 2019 | $1,624 | $15,810 | $3,360 | $12,450 |
| 2018 | $1,457 | $13,020 | $2,510 | $10,510 |
| 2017 | $1,456 | $13,020 | $2,510 | $10,510 |
| 2016 | $1,509 | $13,320 | $2,510 | $10,810 |
| 2015 | $1,477 | $13,320 | $2,510 | $10,810 |
| 2014 | $1,569 | $14,600 | $3,140 | $11,460 |
Source: Public Records
Map
Nearby Homes
- 2484 Blue Heron Dr
- 2 Belmont at River Bluffs Meadows
- 2620 Lindsay Ln
- 2487 Manthorne Ct
- 2 Fieldcrest at River Bluffs Meadows
- 2165 Jenkee Dr
- 2 Meadows
- 2 Meadows
- 2 Sterling at River Bluffs Manors
- 2 Royal II at River Bluffs Manors
- 2 Maple at River Bluffs Manors
- 2 Aspen at River Bluffs Manors Unit Aspen at River Bluff
- 2 Ashford at River Bluffs Manors
- 2 Aspen II at River Bluffs Manors
- 2 Carolina at River Bluffs Meadows
- 2 Berwick at River Bluffs Manors
- 2128 Friendship Ct
- 25 Francisca Dr
- 2 Aspen II at Koch Park Manors
- 282 Noser Dr
- 2452 Soundview Ct
- 2472 Soundview Ct
- 2442 Soundview Ct
- 2482 Soundview Ct
- 2492 Soundview Ct
- 2422 Soundview Ct
- 2503 Soundview Ct
- 2493 Soundview Ct
- 2513 Soundview Ct
- 2502 Soundview Ct
- 2412 Soundview Ct
- 2483 Soundview Ct
- 2523 Soundview Ct
- 2473 Soundview Ct
- 2512 Soundview Ct
- 802 Marrisa Dr
- 2402 Soundview Ct
- 2533 Soundview Ct
- 822 Marrisa Dr
- 2292 Marrisa Dr