Estimated Value: $386,000 - $412,000
4
Beds
1
Bath
1,022
Sq Ft
$386/Sq Ft
Est. Value
About This Home
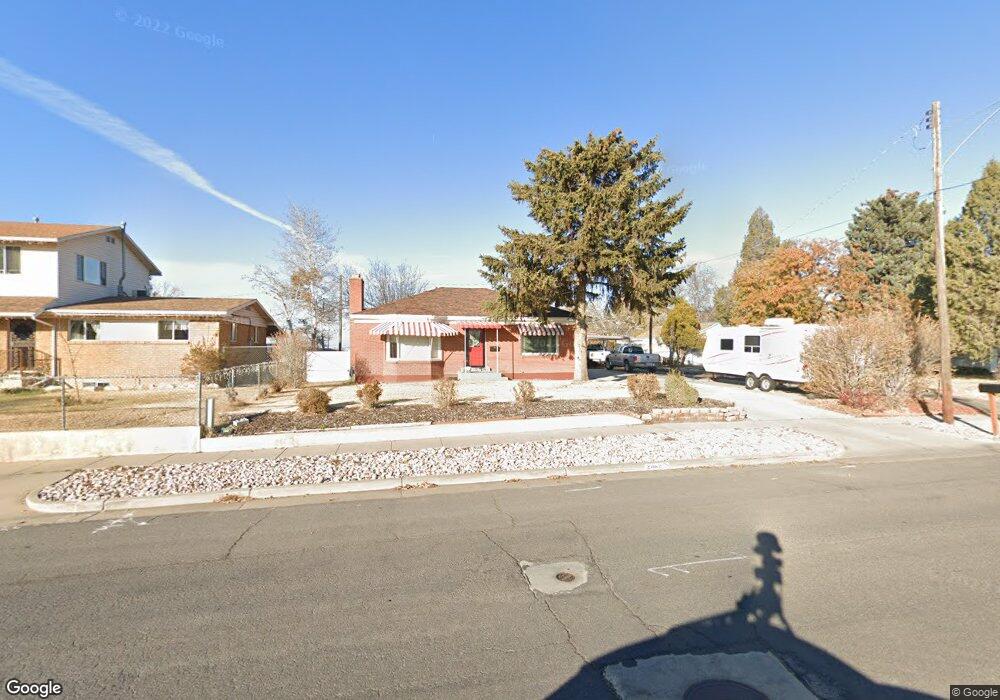
This home is located at 2462 W 4400 S, Roy, UT 84067 and is currently estimated at $394,102, approximately $385 per square foot. 2462 W 4400 S is a home located in Weber County with nearby schools including Valley View School, Sand Ridge Junior High School, and Roy High School.
Ownership History
Date
Name
Owned For
Owner Type
Purchase Details
Closed on
Aug 2, 2022
Sold by
Adams Alanna Jean
Bought by
Betty Jean Mackenzie Living Trust and Johnson
Current Estimated Value
Purchase Details
Closed on
Jul 13, 2022
Sold by
Johnson Tammy A
Bought by
Betty Jean Mackenzie Living Trust and Johnson
Purchase Details
Closed on
Jun 30, 2022
Sold by
Johnson Robert William
Bought by
Betty Jean Mackenzie Living Trust and Johnson
Purchase Details
Closed on
Jun 24, 2022
Sold by
Mcdonald Terrena Louise
Bought by
Betty Jean Mackenzie Living Trust and Johnson
Purchase Details
Closed on
Jun 22, 2022
Sold by
Coombs Jaycine
Bought by
Betty Jean Mackenzie Living Trust and Johnson
Purchase Details
Closed on
Jun 21, 2022
Sold by
Mackenzie Betty Jean
Bought by
Johnson Robert William and Mcdonald Terrena Louise
Purchase Details
Closed on
May 26, 2022
Sold by
Johnson Douglas E
Bought by
Johnson Robert William and Mcdonald Terrena Louise
Create a Home Valuation Report for This Property
The Home Valuation Report is an in-depth analysis detailing your home's value as well as a comparison with similar homes in the area
Home Values in the Area
Average Home Value in this Area
Purchase History
| Date | Buyer | Sale Price | Title Company |
|---|---|---|---|
| Betty Jean Mackenzie Living Trust | -- | None Listed On Document | |
| Betty Jean Mackenzie Living Trust | -- | None Listed On Document | |
| Betty Jean Mackenzie Living Trust | -- | None Listed On Document | |
| Betty Jean Mackenzie Living Trust | -- | None Listed On Document | |
| Betty Jean Mackenzie Living Trust | -- | None Listed On Document | |
| Betty Jean Mackenzie Living Trust | -- | None Listed On Document | |
| Johnson Robert William | -- | None Listed On Document | |
| Johnson Douglas E | -- | -- | |
| Johnson Robert William | -- | Hassing Steven D |
Source: Public Records
Tax History Compared to Growth
Tax History
| Year | Tax Paid | Tax Assessment Tax Assessment Total Assessment is a certain percentage of the fair market value that is determined by local assessors to be the total taxable value of land and additions on the property. | Land | Improvement |
|---|---|---|---|---|
| 2025 | $2,461 | $383,245 | $126,531 | $256,714 |
| 2024 | $2,403 | $207,348 | $69,600 | $137,748 |
| 2023 | $2,256 | $194,150 | $62,795 | $131,355 |
| 2022 | $2,294 | $203,500 | $53,855 | $149,645 |
| 2021 | $1,876 | $272,000 | $69,428 | $202,572 |
| 2020 | $1,777 | $237,000 | $69,428 | $167,572 |
| 2019 | $328 | $211,000 | $41,340 | $169,660 |
| 2018 | $206 | $186,000 | $38,490 | $147,510 |
| 2017 | $203 | $162,000 | $38,490 | $123,510 |
| 2016 | $199 | $77,273 | $17,622 | $59,651 |
| 2015 | $195 | $77,272 | $17,622 | $59,650 |
| 2014 | $192 | $77,272 | $17,622 | $59,650 |
Source: Public Records
Map
Nearby Homes
- 2642 W 4400 S
- 2263 W 4400 S
- 4164 S 2400 W
- 2259 W 4525 S
- 1952 W 5450 S
- 4118 Westlake Dr
- 4328 S 2175 W
- 4670 S 2525 W
- 2802 W 4375 S
- 2816 W 4400 S
- 4110 S 2275 W
- 2082 W 4450 S
- 2777 W 4175 S Unit 229
- 2778 W 4175 S Unit 235
- 4073 S 2175 W
- 2835 W 4200 S
- 4205 S 2075 W
- 4220 S 2075 W
- 4022 S 2725 W
- 4475 S 1975 W