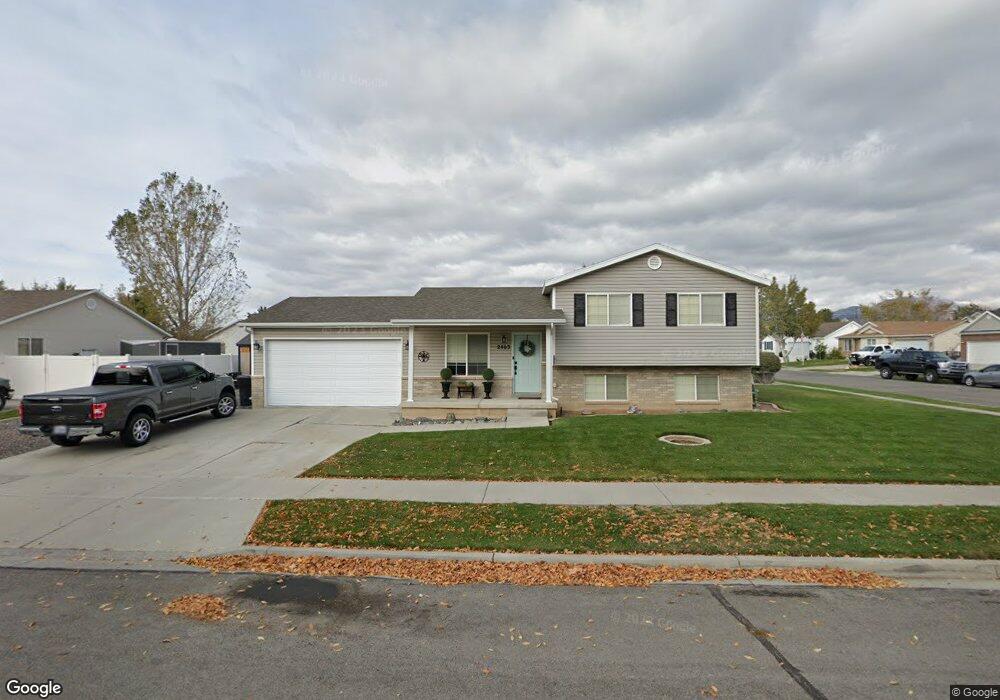
2463 E 1370 S Spanish Fork, UT 84660
Estimated Value: $459,000 - $479,909
4
Beds
3
Baths
1,542
Sq Ft
$306/Sq Ft
Est. Value
About This Home
This home is located at 2463 E 1370 S, Spanish Fork, UT 84660 and is currently estimated at $472,303, approximately $306 per square foot. 2463 E 1370 S is a home located in Utah County with nearby schools including East Meadows Elementary School, Spanish Fork Jr High School, and Spanish Fork High School.
Ownership History
Date
Name
Owned For
Owner Type
Purchase Details
Closed on
Aug 24, 2007
Sold by
Howland Gene L and Howland Dana L
Bought by
Howland Dana L
Current Estimated Value
Purchase Details
Closed on
Dec 22, 2005
Sold by
Strong Kristin
Bought by
Strong Kristin and Petersen Ray
Home Financials for this Owner
Home Financials are based on the most recent Mortgage that was taken out on this home.
Original Mortgage
$23,250
Interest Rate
6.27%
Mortgage Type
Stand Alone Second
Purchase Details
Closed on
May 21, 2002
Sold by
Salsibury Development Lc
Bought by
Ash Brandon D and Ash Mindy R
Create a Home Valuation Report for This Property
The Home Valuation Report is an in-depth analysis detailing your home's value as well as a comparison with similar homes in the area
Home Values in the Area
Average Home Value in this Area
Purchase History
| Date | Buyer | Sale Price | Title Company |
|---|---|---|---|
| Howland Dana L | -- | Accommodation | |
| Strong Kristin | -- | Atlas Title | |
| Strong Kristin | -- | Atlas Title | |
| Ash Brandon D | -- | Provo Land Title Company |
Source: Public Records
Mortgage History
| Date | Status | Borrower | Loan Amount |
|---|---|---|---|
| Previous Owner | Strong Kristin | $23,250 | |
| Previous Owner | Strong Kristin | $124,000 |
Source: Public Records
Tax History
| Year | Tax Paid | Tax Assessment Tax Assessment Total Assessment is a certain percentage of the fair market value that is determined by local assessors to be the total taxable value of land and additions on the property. | Land | Improvement |
|---|---|---|---|---|
| 2025 | $2,156 | $236,005 | -- | -- |
| 2024 | $2,156 | $222,200 | $0 | $0 |
| 2023 | $2,196 | $226,600 | $0 | $0 |
| 2022 | $2,197 | $222,365 | $0 | $0 |
| 2021 | $1,842 | $298,200 | $111,800 | $186,400 |
| 2020 | $1,742 | $274,200 | $101,600 | $172,600 |
| 2019 | $1,524 | $252,300 | $84,600 | $167,700 |
| 2018 | $1,410 | $225,700 | $79,900 | $145,800 |
| 2017 | $1,352 | $116,325 | $0 | $0 |
| 2016 | $1,264 | $107,305 | $0 | $0 |
| 2015 | $1,193 | $100,045 | $0 | $0 |
| 2014 | $1,112 | $93,665 | $0 | $0 |
Source: Public Records
Map
Nearby Homes
- 2237 E 1400 S
- 2662 E 1600 S
- 2376 E 1610 S
- 2744 E 1060 S
- 1072 S 2760 E
- 2741 E 1060 S
- 1068 S 2760 E
- 998 S 2720 E
- 972 S High Ridge Rd
- 1503 S 3740 E Unit 1320
- 1013 S 2740 E
- 1024 S 2770 E
- 1003 S 2740 E
- 2648 E High Ridge Dr
- 2972 E Canyon Meadows Dr Unit 335
- 2984 E Canyon Meadows Dr
- 902 S 2610 E
- 3013 E Canyon Meadows Dr Unit 314
- 804 E 1610 S Unit 91
- 824 E 1610 S Unit 92
Your Personal Tour Guide
Ask me questions while you tour the home.