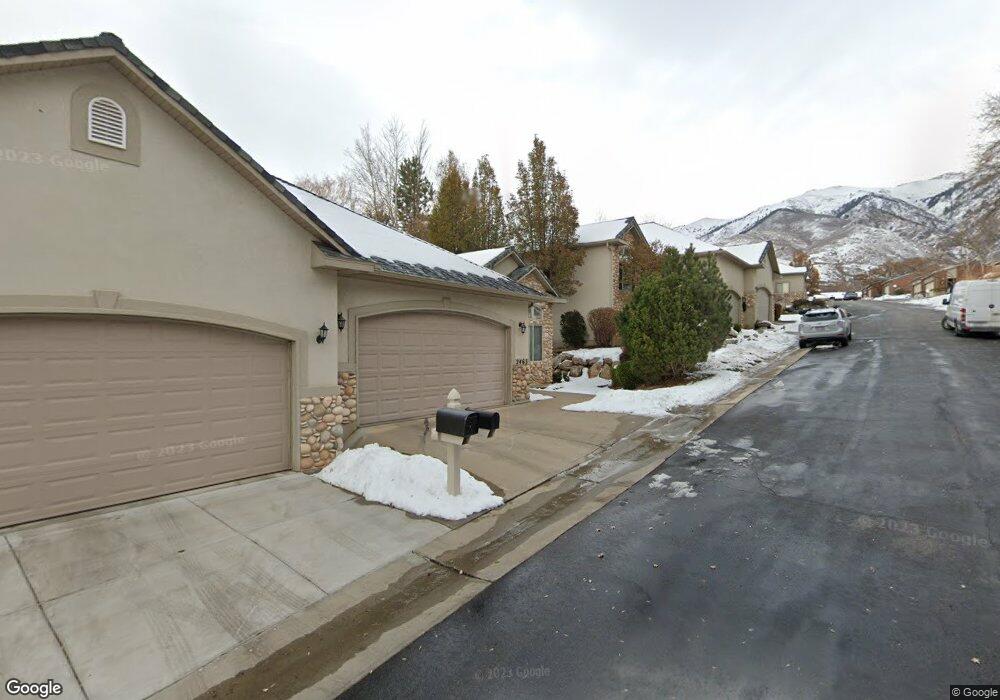
2463 E 1900 N Unit 5 Layton, UT 84040
Estimated Value: $437,000 - $525,000
4
Beds
3
Baths
3,170
Sq Ft
$150/Sq Ft
Est. Value
About This Home
This home is located at 2463 E 1900 N Unit 5, Layton, UT 84040 and is currently estimated at $475,985, approximately $150 per square foot. 2463 E 1900 N Unit 5 is a home located in Davis County with nearby schools including East Layton Elementary School, Central Davis Junior High School, and Northridge High School.
Ownership History
Date
Name
Owned For
Owner Type
Purchase Details
Closed on
Aug 22, 2017
Sold by
Hengel Gayelyn J
Bought by
Hengel Living Trust
Current Estimated Value
Purchase Details
Closed on
Jul 14, 2016
Sold by
Hengel Raymond E and Hengel Gayelyn J
Bought by
Hengel Gayelyn and Gayelyn J Hengel Declaration Of Trust
Purchase Details
Closed on
Nov 16, 2004
Sold by
Nelson Ronald C and Nelson Nancy J
Bought by
Kammeyer Raelene B
Purchase Details
Closed on
Aug 6, 2001
Sold by
Holloway P Todd and Stephens Rodney Gordon
Bought by
Nelson Ronald C and Nelson Nancy J
Home Financials for this Owner
Home Financials are based on the most recent Mortgage that was taken out on this home.
Original Mortgage
$216,900
Interest Rate
7.09%
Mortgage Type
Balloon
Purchase Details
Closed on
Jan 16, 2000
Sold by
Country Oaks Condominium Management Comm
Bought by
Holloway P Todd and Stephens Rodney Gordon
Create a Home Valuation Report for This Property
The Home Valuation Report is an in-depth analysis detailing your home's value as well as a comparison with similar homes in the area
Home Values in the Area
Average Home Value in this Area
Purchase History
| Date | Buyer | Sale Price | Title Company |
|---|---|---|---|
| Hengel Living Trust | -- | -- | |
| Hengel Gayelyn | -- | Metro National Title | |
| Hengel Raymond E | -- | Cottonwood Title | |
| Kammeyer Raelene B | -- | Surety Title Agency | |
| Nelson Ronald C | -- | Bonneville Title Company Inc | |
| Holloway P Todd | -- | First American Title Co |
Source: Public Records
Mortgage History
| Date | Status | Borrower | Loan Amount |
|---|---|---|---|
| Previous Owner | Nelson Ronald C | $216,900 |
Source: Public Records
Tax History Compared to Growth
Tax History
| Year | Tax Paid | Tax Assessment Tax Assessment Total Assessment is a certain percentage of the fair market value that is determined by local assessors to be the total taxable value of land and additions on the property. | Land | Improvement |
|---|---|---|---|---|
| 2025 | $2,447 | $246,950 | $0 | $246,950 |
| 2024 | $2,359 | $240,900 | $0 | $240,900 |
| 2023 | $2,440 | $442,000 | $0 | $442,000 |
| 2022 | $2,463 | $242,550 | $52,250 | $190,300 |
| 2021 | $2,350 | $345,000 | $71,000 | $274,000 |
| 2020 | $2,410 | $340,000 | $53,800 | $286,200 |
| 2019 | $2,322 | $321,000 | $51,700 | $269,300 |
| 2018 | $2,102 | $291,000 | $39,500 | $251,500 |
| 2016 | $1,710 | $122,870 | $21,725 | $101,145 |
| 2015 | $1,836 | $125,913 | $21,725 | $104,188 |
| 2014 | $1,649 | $115,964 | $18,333 | $97,631 |
| 2013 | -- | $98,208 | $18,700 | $79,508 |
Source: Public Records
Map
Nearby Homes
- 2141 E Oak Ln Unit 5
- 2316 E 1975 N
- 2202 N 2300 E
- 2345 E Cherry Ln
- 1522 N 2200 E
- 2136 N 2800 E
- 2563 E 2250 N
- 2411 Kays Creek Dr
- 2011 Dan Dr
- 1332 N 2350 E
- 2594 Joni Dr
- 1283 N 2575 E
- 1870 N Valley View Dr Unit 201
- 2273 N 1975 E
- 1262 N 2575 E
- 1975 E 1425 N
- 1735 Hayes Dr
- 2777 E 2700 N
- 1657 E Cherry Ln
- 1204 N 1875 E Unit 5
- 2455 E 1900 N
- 2463 E 1900 N
- 2475 E 1900 N
- 2475 E 1900 N Unit 4
- 2443 E 1900 N
- 2437 E 1900 N
- 2437 E 1900 N Unit Lot 8
- 2481 E 1900 N
- 2456 E 1950 N
- 2456 E 1950 N Unit 15
- 2468 E 1950 N Unit 30
- 2480 E 1950 N
- 2423 E 1900 N
- 2493 E 1900 N
- 2495 E 1825 N
- 2415 E 1900 N
- 1959 N 2450 E Unit 27
- 2495 E 1900 N
- 2412 E 1900 N
- 2513 E 1825 N