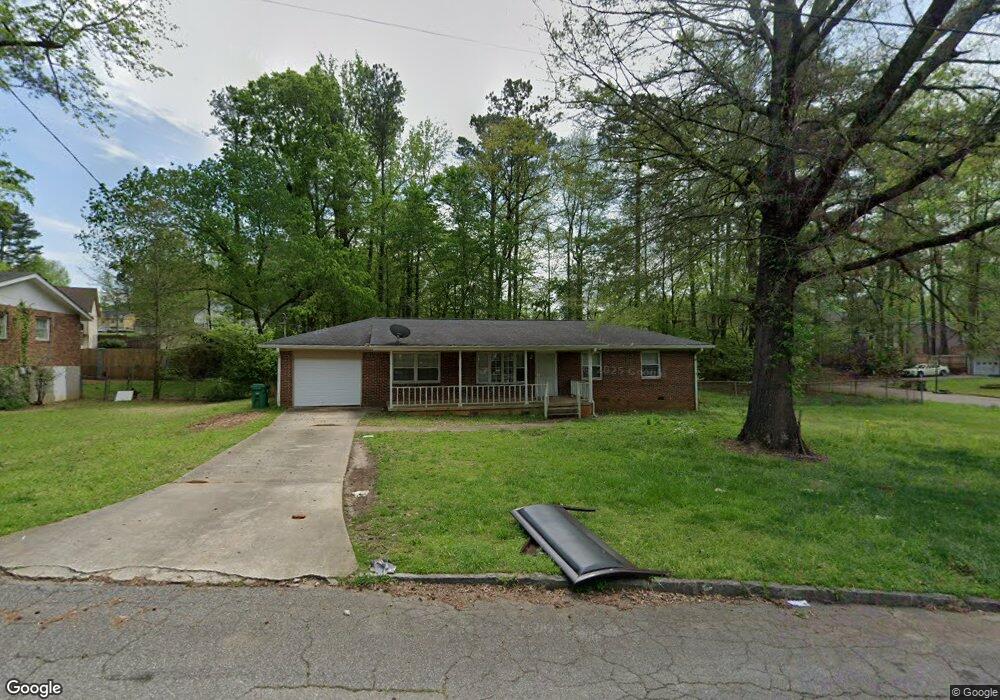
2463 Montezuma Cir Ellenwood, GA 30294
Southwest DeKalb NeighborhoodEstimated Value: $172,000 - $290,000
3
Beds
2
Baths
1,252
Sq Ft
$203/Sq Ft
Est. Value
About This Home
This home is located at 2463 Montezuma Cir, Ellenwood, GA 30294 and is currently estimated at $253,622, approximately $202 per square foot. 2463 Montezuma Cir is a home located in DeKalb County with nearby schools including Cedar Grove Elementary School, Cedar Grove Middle School, and Cedar Grove High School.
Ownership History
Date
Name
Owned For
Owner Type
Purchase Details
Closed on
Apr 29, 2022
Sold by
Dbc Atlanta Properties Llc
Bought by
Ao Propco 1 Llc
Current Estimated Value
Purchase Details
Closed on
May 3, 2018
Sold by
King Mac Ventures Llc
Bought by
Dbc Atlanta Properties Llc
Purchase Details
Closed on
Dec 31, 2015
Sold by
Homes 4 U And More Llc
Bought by
King Mac Ventures Llc
Purchase Details
Closed on
Oct 7, 2008
Sold by
Bryant Michael
Bought by
Citizens Trust Bk
Purchase Details
Closed on
Oct 15, 2002
Sold by
Cartwright Opal I
Bought by
Bryant Michael
Home Financials for this Owner
Home Financials are based on the most recent Mortgage that was taken out on this home.
Original Mortgage
$106,700
Interest Rate
6.01%
Mortgage Type
New Conventional
Create a Home Valuation Report for This Property
The Home Valuation Report is an in-depth analysis detailing your home's value as well as a comparison with similar homes in the area
Home Values in the Area
Average Home Value in this Area
Purchase History
| Date | Buyer | Sale Price | Title Company |
|---|---|---|---|
| Ao Propco 1 Llc | $3,610,438 | -- | |
| Dbc Atlanta Properties Llc | $76,400 | -- | |
| King Mac Ventures Llc | $46,000 | -- | |
| Citizens Trust Bk | $85,000 | -- | |
| Bryant Michael | $110,500 | -- |
Source: Public Records
Mortgage History
| Date | Status | Borrower | Loan Amount |
|---|---|---|---|
| Previous Owner | Bryant Michael | $106,700 |
Source: Public Records
Tax History Compared to Growth
Tax History
| Year | Tax Paid | Tax Assessment Tax Assessment Total Assessment is a certain percentage of the fair market value that is determined by local assessors to be the total taxable value of land and additions on the property. | Land | Improvement |
|---|---|---|---|---|
| 2025 | $6,224 | $131,760 | $11,858 | $119,902 |
| 2024 | $6,225 | $131,760 | $11,858 | $119,902 |
| 2023 | $6,225 | $131,760 | $12,000 | $119,760 |
| 2022 | $2,585 | $50,720 | $8,960 | $41,760 |
| 2021 | $2,585 | $50,720 | $8,960 | $41,760 |
| 2020 | $1,840 | $33,760 | $8,960 | $24,800 |
| 2019 | $1,700 | $30,560 | $6,840 | $23,720 |
| 2018 | $1,476 | $28,400 | $8,960 | $19,440 |
| 2017 | $1,420 | $22,360 | $8,960 | $13,400 |
| 2016 | $1,170 | $18,372 | $7,452 | $10,920 |
| 2014 | $830 | $10,400 | $8,920 | $1,480 |
Source: Public Records
Map
Nearby Homes
- 2496 Montezuma Cir
- 4425 Boulder Springs Cove
- 3902 Bouldercrest Rd
- 4078 Bouldercrest Rd
- 4310 Loveless Place
- 2669 Woodfen Dr
- 3027 Wentworth Ave
- 4330 Cedar Valley Ln
- 4290 Cedar Valley Ln
- 3028 Wentworth Ave
- 4329 Cedar Valley Ln
- 4395 Ward Bluff Ct
- 4130 Windrock Dr
- 4032 Ward Lake Trail
- 2264 Silver Maple Cir Unit 176
- 4044 Ward Lake Trail
- 4026 Villagewood Ln
- 4034 Villagewood Ln
- 2471 Montezuma Cir
- 2423 Boulder Springs Dr Unit 2
- 2430 Yolanda Trail
- 2415 Boulder Springs Dr
- 2436 Yolanda Trail
- 2472 Montezuma Cir
- 2444 Yolanda Trail
- 2460 Boulder Springs Point
- 2479 Montezuma Cir
- 2465 Boulder Springs Point
- 2429 Boulder Springs Dr Unit 2
- 2429 Boulder Springs Dr
- 2450 Yolanda Trail
- 2480 Montezuma Cir
- 2495 Boulder Springs Dr
- 2463 Yolanda Trail
- 2407 Boulder Springs Dr
- 2456 Yolanda Trail
- 2487 Montezuma Cir
- 2435 Boulder Springs Dr Unit 2