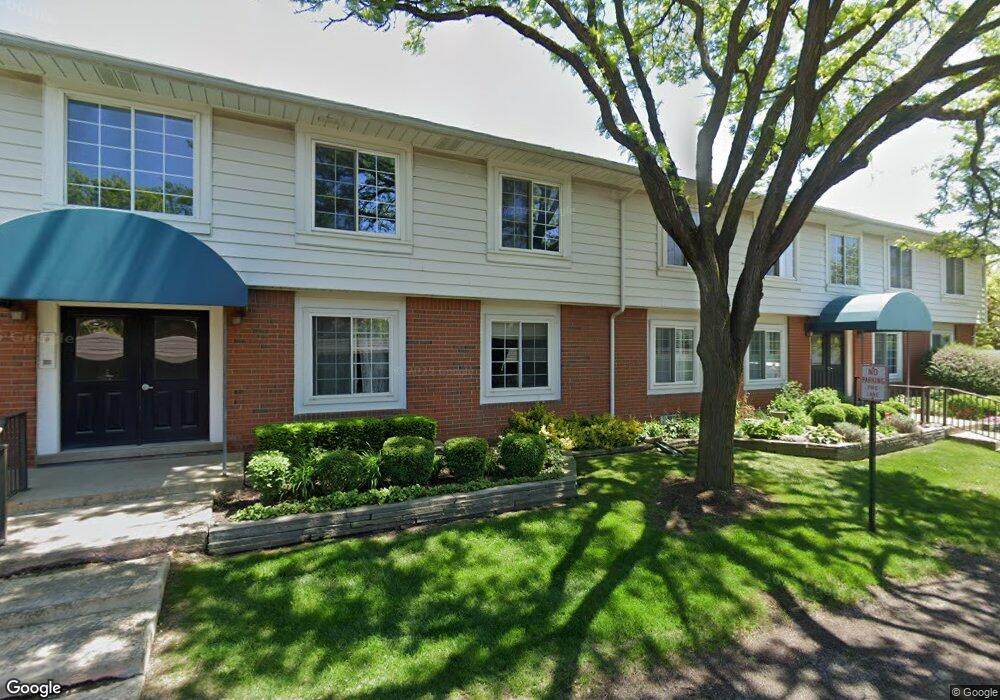
2463 Mulberry Square Bloomfield Hills, MI 48302
Estimated Value: $192,000 - $212,336
2
Beds
2
Baths
1,403
Sq Ft
$142/Sq Ft
Est. Value
About This Home
This home is located at 2463 Mulberry Square, Bloomfield Hills, MI 48302 and is currently estimated at $199,584, approximately $142 per square foot. 2463 Mulberry Square is a home located in Oakland County with nearby schools including Eastover Elementary School, Bloomfield Hills High School, and Arts & Technology Academy of Pontiac.
Ownership History
Date
Name
Owned For
Owner Type
Purchase Details
Closed on
Jun 9, 2023
Sold by
Zingas Maria S
Bought by
Zingas Maria S and Cardans Sawanna K
Current Estimated Value
Purchase Details
Closed on
Mar 31, 2023
Sold by
Srinivasan Sushila
Bought by
Zingas Maria S
Purchase Details
Closed on
Oct 30, 2019
Sold by
Challah Chafic
Bought by
Srinivasan Sushila
Purchase Details
Closed on
Jul 23, 2014
Sold by
Cruice Terrence T
Bought by
Challah Chafic M
Purchase Details
Closed on
May 28, 2014
Sold by
Cruice Terrence T
Bought by
Cruice Terrence T and Terrence T Cruice Trust
Purchase Details
Closed on
Jan 25, 2013
Sold by
Cruice Cruice J and Cruice Mary V
Bought by
Cruice J Timothy and Cruice Mary V
Purchase Details
Closed on
Sep 20, 1996
Sold by
Terry Lois J
Bought by
Cruice J Timothy
Create a Home Valuation Report for This Property
The Home Valuation Report is an in-depth analysis detailing your home's value as well as a comparison with similar homes in the area
Home Values in the Area
Average Home Value in this Area
Purchase History
| Date | Buyer | Sale Price | Title Company |
|---|---|---|---|
| Zingas Maria S | -- | None Listed On Document | |
| Zingas Maria S | $164,175 | Coretitle | |
| Srinivasan Sushila | $122,475 | First American Title | |
| Challah Chafic M | $75,000 | Seaver Title Agency | |
| Cruice Terrence T | $67,000 | Seaver Title Agency Llc | |
| Cruice J Timothy | -- | None Available | |
| Cruice J Timothy | $85,900 | -- |
Source: Public Records
Tax History Compared to Growth
Tax History
| Year | Tax Paid | Tax Assessment Tax Assessment Total Assessment is a certain percentage of the fair market value that is determined by local assessors to be the total taxable value of land and additions on the property. | Land | Improvement |
|---|---|---|---|---|
| 2024 | $1,407 | $75,600 | $0 | $0 |
| 2023 | $1,255 | $66,830 | $0 | $0 |
| 2022 | $3,153 | $63,220 | $0 | $0 |
| 2021 | $3,117 | $66,600 | $0 | $0 |
| 2020 | $1,506 | $61,280 | $0 | $0 |
| 2019 | $1,253 | $52,920 | $0 | $0 |
| 2018 | $1,259 | $48,300 | $0 | $0 |
| 2017 | $1,250 | $47,420 | $0 | $0 |
| 2016 | $1,253 | $41,490 | $0 | $0 |
| 2015 | -- | $31,850 | $0 | $0 |
| 2014 | -- | $29,200 | $0 | $0 |
| 2011 | -- | $20,010 | $0 | $0 |
Source: Public Records
Map
Nearby Homes
- 2449 Mulberry Square Unit 31
- 2383 Mulberry Square Unit 72
- 2449 Mulberry Square Unit 28
- 2442 Mulberry Square Unit 36
- 95 Hillsdale Rd
- 2625 Plum Brook Dr
- 42160 Woodward Ave Unit 8
- 42160 Woodward Ave
- 2724 Alveston Dr
- 448 Fox Hills Dr S Unit 3
- 136 Belroi Place
- 2665 Lahser Rd
- 454 N Fox Hills Dr Unit A-8
- 480 Fox Hills Dr N Unit 6
- 433 Fox Hills Dr S Unit 5
- 00 S Berkshire
- 112 E Hickory Grove Rd Unit 26
- 2615 Warwick Dr
- 2993 Aldgate Dr
- 41350 Woodward Ave Unit 8
- 2463 Mulberry Square
- 2463 Mulberry Square
- 2463 Mulberry Square
- 2463 Mulberry Square Unit 13 Sq
- 2463 Mulberry Square Unit 10
- 2441 Mulberry Square Unit 29 29
- 2441 Mulberry Square
- 2441 Mulberry Square
- 2441 Mulberry Square
- 2441 Mulberry Square
- 2441 Mulberry Square Unit 30
- 2441 Mulberry Square Unit 26
- 2441 Mulberry Square Unit 29
- 2442 Mulberry Square Unit 40
- 2442 Mulberry Square Unit 2442 40
- 2442 Mulberry Square
- 2442 Mulberry Square
- 2442 Mulberry Square
- 2442 Mulberry Square Unit 2442 36
- 2442 Mulberry Square Unit 39