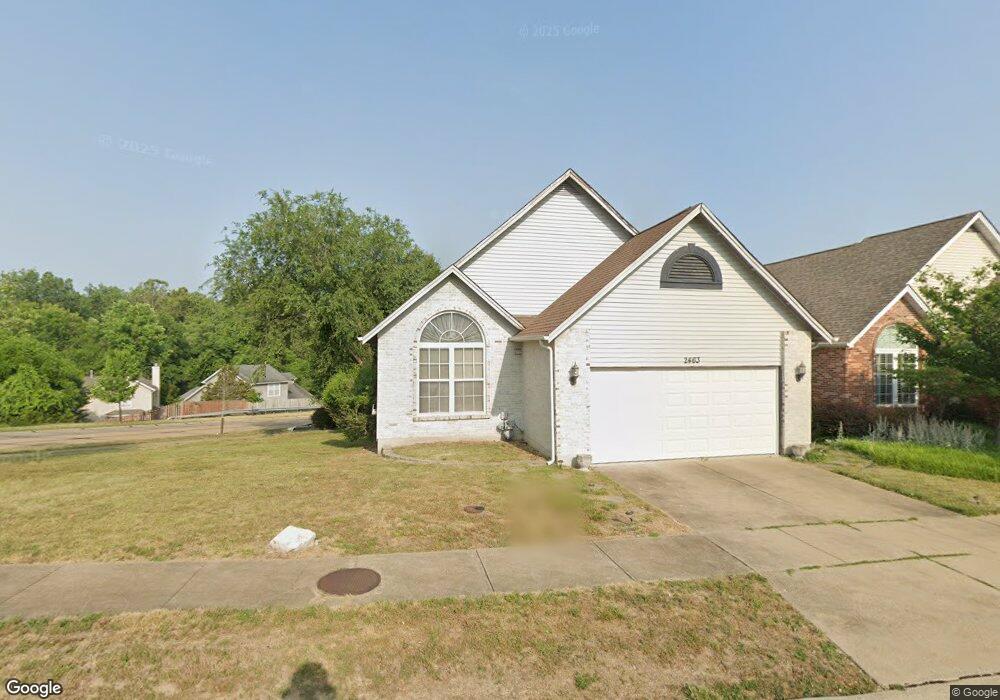
2463 Shiva Ct Ballwin, MO 63011
Estimated Value: $362,000 - $383,000
3
Beds
3
Baths
1,380
Sq Ft
$271/Sq Ft
Est. Value
About This Home
This home is located at 2463 Shiva Ct, Ballwin, MO 63011 and is currently estimated at $374,111, approximately $271 per square foot. 2463 Shiva Ct is a home located in St. Louis County with nearby schools including Green Pines Elementary School, Wildwood Middle School, and Lafayette High School.
Ownership History
Date
Name
Owned For
Owner Type
Purchase Details
Closed on
Aug 7, 2015
Sold by
Hastings Stephen J and Hasting Steve
Bought by
Hastings Stephen J
Current Estimated Value
Home Financials for this Owner
Home Financials are based on the most recent Mortgage that was taken out on this home.
Original Mortgage
$100,000
Outstanding Balance
$78,916
Interest Rate
4.13%
Mortgage Type
New Conventional
Estimated Equity
$295,195
Purchase Details
Closed on
Jan 30, 2003
Sold by
Goodman Brian L and Goodman Tammy L
Bought by
Hastings Steve
Home Financials for this Owner
Home Financials are based on the most recent Mortgage that was taken out on this home.
Original Mortgage
$165,300
Interest Rate
5.84%
Purchase Details
Closed on
Dec 4, 1997
Sold by
Goodman Brian L and Goodman Tammy L
Bought by
Goodman Brian L and Goodman Tammy L
Home Financials for this Owner
Home Financials are based on the most recent Mortgage that was taken out on this home.
Original Mortgage
$27,850
Interest Rate
7.3%
Create a Home Valuation Report for This Property
The Home Valuation Report is an in-depth analysis detailing your home's value as well as a comparison with similar homes in the area
Home Values in the Area
Average Home Value in this Area
Purchase History
| Date | Buyer | Sale Price | Title Company |
|---|---|---|---|
| Hastings Stephen J | -- | Title Resources Inc | |
| Hastings Steve | $174,000 | -- | |
| Goodman Brian L | -- | Nations Title Agency Inc |
Source: Public Records
Mortgage History
| Date | Status | Borrower | Loan Amount |
|---|---|---|---|
| Open | Hastings Stephen J | $100,000 | |
| Closed | Hastings Steve | $165,300 | |
| Previous Owner | Goodman Brian L | $27,850 |
Source: Public Records
Tax History Compared to Growth
Tax History
| Year | Tax Paid | Tax Assessment Tax Assessment Total Assessment is a certain percentage of the fair market value that is determined by local assessors to be the total taxable value of land and additions on the property. | Land | Improvement |
|---|---|---|---|---|
| 2025 | $4,251 | $62,740 | $17,520 | $45,220 |
| 2024 | $4,251 | $61,140 | $13,130 | $48,010 |
| 2023 | $4,251 | $61,140 | $13,130 | $48,010 |
| 2022 | $3,676 | $49,140 | $12,260 | $36,880 |
| 2021 | $3,649 | $49,140 | $12,260 | $36,880 |
| 2020 | $3,367 | $43,240 | $9,630 | $33,610 |
| 2019 | $3,381 | $43,240 | $9,630 | $33,610 |
| 2018 | $2,950 | $35,580 | $5,240 | $30,340 |
| 2017 | $2,880 | $35,580 | $5,240 | $30,340 |
| 2016 | $2,851 | $33,870 | $5,240 | $28,630 |
| 2015 | $2,793 | $33,870 | $5,240 | $28,630 |
| 2014 | $3,039 | $35,950 | $8,020 | $27,930 |
Source: Public Records
Map
Nearby Homes
- 2452 Autumn Pines Dr
- 2531 Elm Forest Ct
- 2551 Forest Leaf Pkwy
- 110 Sweet Cherry Way
- 116 Sweet Cherry Way
- 16307 Autumn View Terrace Dr
- 112 Boathouse Dr
- 375 Thunderhead Canyon Dr
- 16621 Green Pines Dr
- 16567 Thunderhead Canyon Ct
- 16672 Westglen Farms Dr
- 2381 Gross Point Ln
- 2308 Sand Cherry Dr
- 2003 Centennial Ct
- 16509 Carriage View Ct
- 16549 Carriage View Ct
- 424 Saint Thomas Isle Ln
- 2424 Eatherton Rd
- 16773 Babler View Dr
- 160 Jubilee Hill Dr Unit G