Estimated Value: $399,000 - $451,000
5
Beds
3
Baths
2,376
Sq Ft
$181/Sq Ft
Est. Value
About This Home
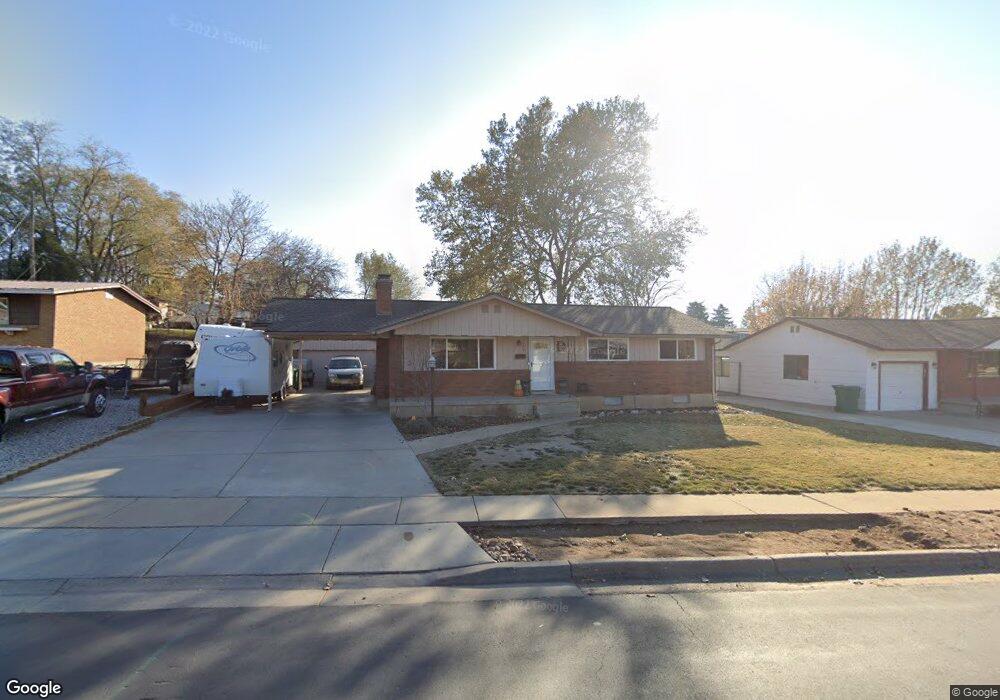
This home is located at 2463 W 4750 S, Roy, UT 84067 and is currently estimated at $430,815, approximately $181 per square foot. 2463 W 4750 S is a home located in Weber County with nearby schools including Valley View School, Sand Ridge Junior High School, and Roy High School.
Ownership History
Date
Name
Owned For
Owner Type
Purchase Details
Closed on
Aug 12, 2022
Sold by
Dixon Roger B and Dixon Mary Ann
Bought by
Dixon Family Living Trust
Current Estimated Value
Purchase Details
Closed on
Jun 12, 2010
Sold by
Eliason James Martin and Eliason Donna Jean
Bought by
Eliason James and Eliason Donna
Home Financials for this Owner
Home Financials are based on the most recent Mortgage that was taken out on this home.
Original Mortgage
$124,000
Interest Rate
4.99%
Mortgage Type
New Conventional
Create a Home Valuation Report for This Property
The Home Valuation Report is an in-depth analysis detailing your home's value as well as a comparison with similar homes in the area
Home Values in the Area
Average Home Value in this Area
Purchase History
| Date | Buyer | Sale Price | Title Company |
|---|---|---|---|
| Dixon Family Living Trust | -- | -- | |
| Eliason James | -- | Preferred Title & Escrow Ins |
Source: Public Records
Mortgage History
| Date | Status | Borrower | Loan Amount |
|---|---|---|---|
| Previous Owner | Eliason James | $124,000 |
Source: Public Records
Tax History Compared to Growth
Tax History
| Year | Tax Paid | Tax Assessment Tax Assessment Total Assessment is a certain percentage of the fair market value that is determined by local assessors to be the total taxable value of land and additions on the property. | Land | Improvement |
|---|---|---|---|---|
| 2025 | $2,058 | $410,007 | $122,630 | $287,377 |
| 2024 | $2,010 | $221,649 | $67,447 | $154,202 |
| 2023 | $1,823 | $201,849 | $64,239 | $137,610 |
| 2022 | $2,381 | $243,100 | $55,729 | $187,371 |
| 2021 | $1,779 | $310,000 | $71,325 | $238,675 |
| 2020 | $1,588 | $261,001 | $71,325 | $189,676 |
| 2019 | $1,481 | $233,000 | $40,995 | $192,005 |
| 2018 | $1,833 | $222,000 | $36,920 | $185,080 |
| 2017 | $1,612 | $181,000 | $36,920 | $144,080 |
| 2016 | $1,515 | $91,135 | $19,302 | $71,833 |
| 2015 | $1,327 | $80,762 | $19,302 | $61,460 |
| 2014 | $1,318 | $79,396 | $16,433 | $62,963 |
Source: Public Records
Map
Nearby Homes