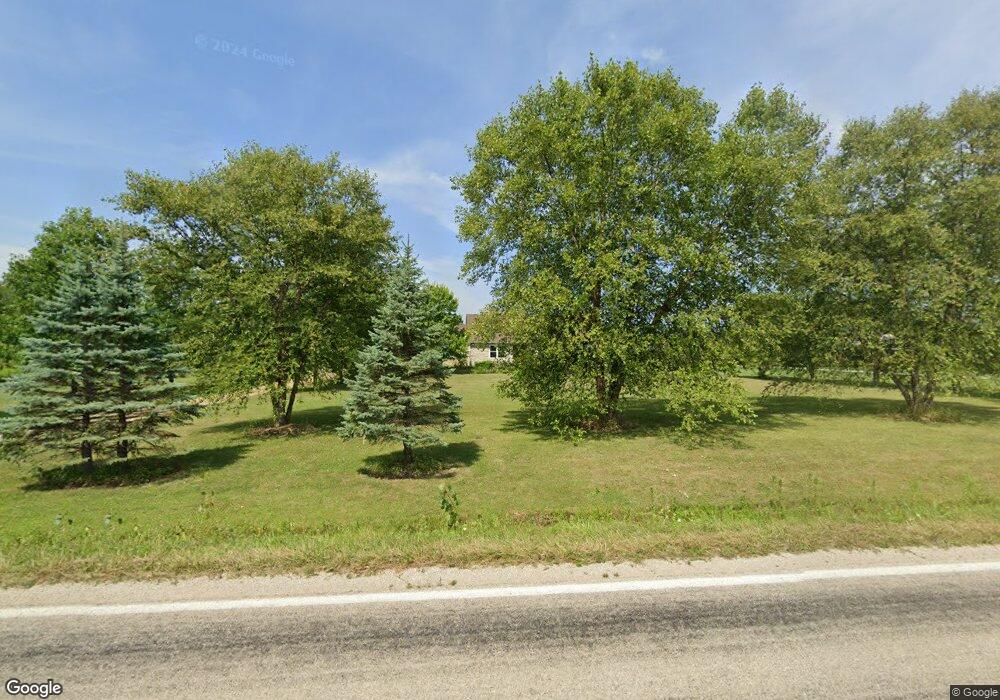
2464 S State Route 605 Galena, OH 43021
Harlem NeighborhoodEstimated Value: $591,000 - $652,027
3
Beds
3
Baths
2,193
Sq Ft
$285/Sq Ft
Est. Value
About This Home
This home is located at 2464 S State Route 605, Galena, OH 43021 and is currently estimated at $626,007, approximately $285 per square foot. 2464 S State Route 605 is a home located in Delaware County with nearby schools including Hylen Souders Elementary School, Big Walnut Intermediate School, and Big Walnut Middle School.
Ownership History
Date
Name
Owned For
Owner Type
Purchase Details
Closed on
Jun 26, 2015
Sold by
Power Patrick J and Baumgardner Sue E
Bought by
Paul Baumgardner Family Trust and Baumgardner Sue E
Current Estimated Value
Purchase Details
Closed on
Sep 26, 2007
Sold by
Phillips Doris E
Bought by
Power Patrick J and Baumgardner Sue E
Home Financials for this Owner
Home Financials are based on the most recent Mortgage that was taken out on this home.
Original Mortgage
$180,000
Outstanding Balance
$114,015
Interest Rate
6.49%
Mortgage Type
Purchase Money Mortgage
Estimated Equity
$511,992
Purchase Details
Closed on
Aug 3, 2004
Sold by
Loften A Phillips Trust and Phillips Loften A
Bought by
Phillips Doris E
Purchase Details
Closed on
Aug 29, 2001
Sold by
Mckee Larry
Bought by
Phillips Loften A
Create a Home Valuation Report for This Property
The Home Valuation Report is an in-depth analysis detailing your home's value as well as a comparison with similar homes in the area
Home Values in the Area
Average Home Value in this Area
Purchase History
| Date | Buyer | Sale Price | Title Company |
|---|---|---|---|
| Paul Baumgardner Family Trust | -- | Attorney | |
| Power Patrick J | $265,000 | Attorney | |
| Phillips Doris E | -- | -- | |
| Phillips Loften A | $63,000 | -- |
Source: Public Records
Mortgage History
| Date | Status | Borrower | Loan Amount |
|---|---|---|---|
| Open | Power Patrick J | $180,000 |
Source: Public Records
Tax History Compared to Growth
Tax History
| Year | Tax Paid | Tax Assessment Tax Assessment Total Assessment is a certain percentage of the fair market value that is determined by local assessors to be the total taxable value of land and additions on the property. | Land | Improvement |
|---|---|---|---|---|
| 2024 | $7,478 | $172,130 | $63,070 | $109,060 |
| 2023 | $7,208 | $172,130 | $63,070 | $109,060 |
| 2022 | $5,525 | $112,670 | $41,620 | $71,050 |
| 2021 | $5,498 | $112,670 | $41,620 | $71,050 |
| 2020 | $5,516 | $112,670 | $41,620 | $71,050 |
| 2019 | $5,205 | $102,590 | $31,540 | $71,050 |
| 2018 | $4,917 | $102,590 | $31,540 | $71,050 |
| 2017 | $4,588 | $89,220 | $23,590 | $65,630 |
| 2016 | $3,964 | $89,220 | $23,590 | $65,630 |
| 2015 | $3,923 | $89,220 | $23,590 | $65,630 |
| 2014 | $4,054 | $89,220 | $23,590 | $65,630 |
| 2013 | $4,180 | $84,910 | $23,590 | $61,320 |
Source: Public Records
Map
Nearby Homes
- 0 Woodtown Rd Unit Tract 9 222017618
- 0 Woodtown Rd Unit Tract 7 225015946
- 0 Woodtown Rd Unit Tract 6 225015959
- 0 Trenton Rd Unit 13.73 Acres
- 733 S State Route 605
- 720 Green Cook Rd
- 14859 Center Village Rd
- 15255 E State Route 37
- 16345 E State Route 37
- 14494 E State Route 37
- 13535 Vans Valley Rd
- 0 Piper Place Unit 316 225024755
- Erwine Residence Plan at The Oaks at Big Walnut
- Sawyer Plan at The Oaks at Big Walnut
- DeLuca Residence Plan at The Oaks at Big Walnut
- Beckner Residence Plan at The Oaks at Big Walnut
- Izabella Plan at The Oaks at Big Walnut
- Froehlich Residence Plan at The Oaks at Big Walnut
- Carroll Residence Plan at The Oaks at Big Walnut
- Barnard Residence Plan at The Oaks at Big Walnut
- 2305 S State Route 605
- 2530 S State Route 605
- 2424 S State Route 605
- 2341 S State Route 605
- 2529 S State Route 605
- 13688 Woodtown Rd
- 2590 S State Route 605
- 2568 S State Route 605
- 13600 Woodtown Rd
- 2054 Ohio 605
- 3480 Ohio 605
- 13534 Woodtown Rd
- 2623 S State Route 605
- 2640 S State Route 605
- 13617 Woodtown Rd
- 0 S State Route 605 Unit 210000321
- 2658 S State Route 605
- 13420 Woodtown Rd
- 2736 S State Route 605
- 13587 Woodtown Rd