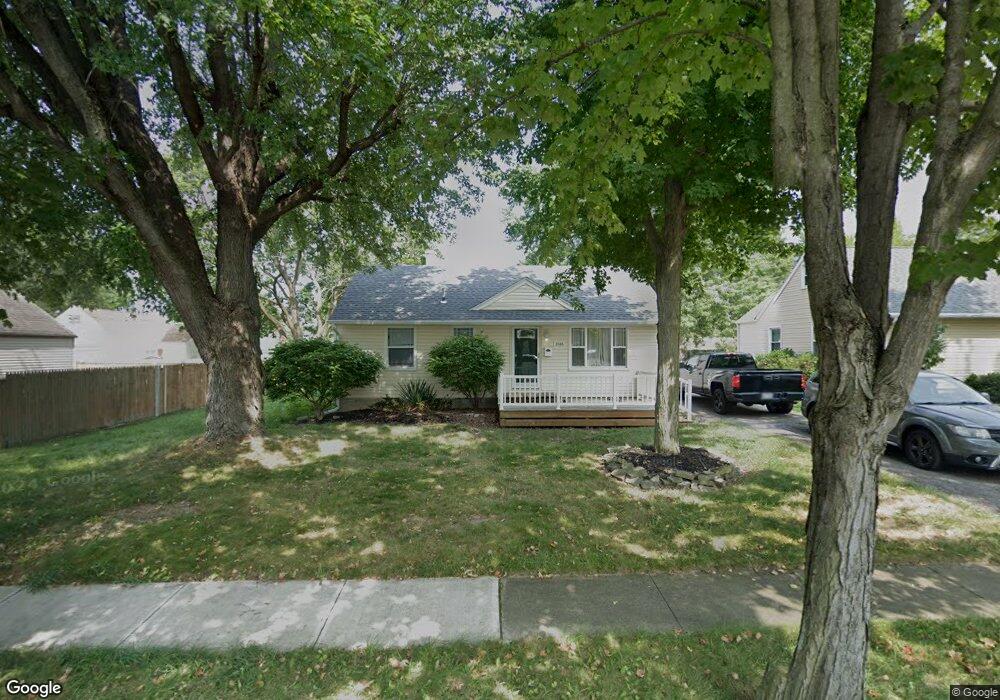
2464 W Spring St Lima, OH 45805
Lakewood West NeighborhoodEstimated Value: $115,000 - $183,000
2
Beds
1
Bath
864
Sq Ft
$171/Sq Ft
Est. Value
About This Home
This home is located at 2464 W Spring St, Lima, OH 45805 and is currently estimated at $147,667, approximately $170 per square foot. 2464 W Spring St is a home located in Allen County with nearby schools including Heritage Elementary School, Lima West Middle School, and Lima North Middle School.
Ownership History
Date
Name
Owned For
Owner Type
Purchase Details
Closed on
Jun 24, 2022
Sold by
Helmig Edward E and Helmig Joanne
Bought by
Rumbaugh Properties Llc
Current Estimated Value
Purchase Details
Closed on
Jun 21, 2022
Bought by
Edward E Helmig
Purchase Details
Closed on
Nov 8, 1999
Sold by
Wappelhorst Antonia D
Bought by
Helmig Wendy M
Home Financials for this Owner
Home Financials are based on the most recent Mortgage that was taken out on this home.
Original Mortgage
$49,591
Interest Rate
7.78%
Mortgage Type
FHA
Purchase Details
Closed on
Mar 31, 1994
Sold by
Jones Edward D
Bought by
Schoonover Antonia D
Purchase Details
Closed on
Aug 1, 1982
Bought by
Westminster Christian
Create a Home Valuation Report for This Property
The Home Valuation Report is an in-depth analysis detailing your home's value as well as a comparison with similar homes in the area
Home Values in the Area
Average Home Value in this Area
Purchase History
| Date | Buyer | Sale Price | Title Company |
|---|---|---|---|
| Rumbaugh Properties Llc | $40,000 | Hunt & Johnson Llc | |
| Edward E Helmig | -- | -- | |
| Helmig Wendy M | $50,000 | -- | |
| Schoonover Antonia D | $38,000 | -- | |
| Westminster Christian | -- | -- |
Source: Public Records
Mortgage History
| Date | Status | Borrower | Loan Amount |
|---|---|---|---|
| Previous Owner | Helmig Wendy M | $49,591 |
Source: Public Records
Tax History
| Year | Tax Paid | Tax Assessment Tax Assessment Total Assessment is a certain percentage of the fair market value that is determined by local assessors to be the total taxable value of land and additions on the property. | Land | Improvement |
|---|---|---|---|---|
| 2024 | $1,196 | $31,580 | $7,320 | $24,260 |
| 2023 | $1,009 | $22,230 | $5,150 | $17,080 |
| 2022 | $981 | $22,230 | $5,150 | $17,080 |
| 2021 | $1,006 | $22,230 | $5,150 | $17,080 |
| 2020 | $1,032 | $19,990 | $4,870 | $15,120 |
| 2019 | $1,032 | $19,990 | $4,870 | $15,120 |
| 2018 | $1,007 | $19,990 | $4,870 | $15,120 |
| 2017 | $938 | $18,030 | $4,870 | $13,160 |
| 2016 | $965 | $18,030 | $4,870 | $13,160 |
| 2015 | $984 | $18,030 | $4,870 | $13,160 |
| 2014 | $984 | $18,840 | $5,220 | $13,620 |
| 2013 | $957 | $18,840 | $5,220 | $13,620 |
Source: Public Records
Map
Nearby Homes
- 2802 Lowell Ave
- 2700 Lowell Ave
- 2949 Lakewood Ave
- 2201 W High St
- 161 S Cable Rd
- 2964 Hanover Dr
- 2921 Canterbury Dr
- 275 N Dale Dr
- 2057 W High St
- 1880 Wendell Ave
- 3071 Canterbury Dr
- N/A Eastown Rd N
- 2940 Koop Rd
- 206 Eagles Point St E
- 2997 Cletus Pkwy
- 1918 Oakland Pkwy
- 147 Eagles Point St S
- 123 Eagles Point W
- XXXX Spencerville Rd
- 2250 Kunneke Ave
Your Personal Tour Guide
Ask me questions while you tour the home.