
Seller's Agent in 2025
Colin Call
RE/MAX
(541) 579-1615
13 in this area
95 Total Sales

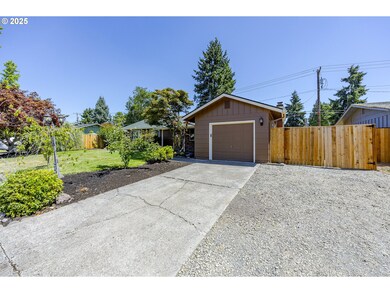
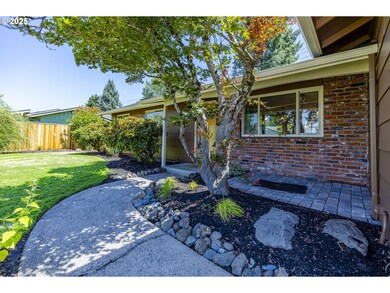
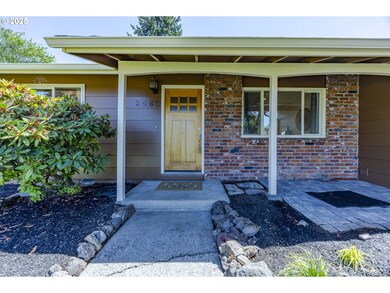
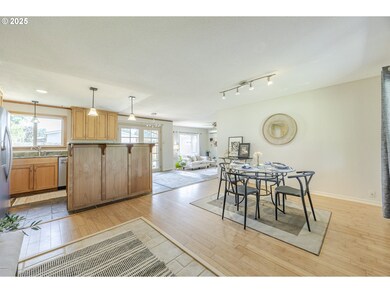
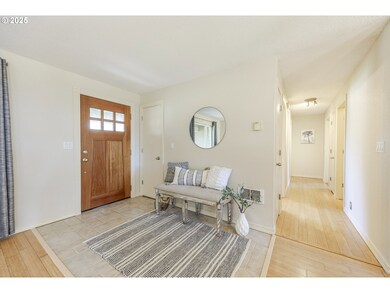
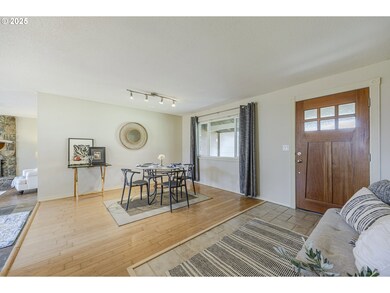
Enjoy this gem while it's on the market. Primed to sell. The owner has put a great new 50 year roof on the home, had both the interior and exterior painted, rocked a nice gated RV pad, installed a new backyard deck and landscaped the front and back yards (including new irrigation in the back). Every time I go to the house it brings a smile to my face. I could gush all day about this home but would prefer you get your realtor to take you there so you can do your own gushing. Hurry! Won't be on the market long.
Last Agent to Sell the Property
RE/MAX Integrity Brokerage Phone: 541-345-8100 License #950100138 Listed on: 08/01/2025
| Date | Type | Sale Price | Title Company |
|---|---|---|---|
| Warranty Deed | $400,000 | Cascade Title | |
| Warranty Deed | -- | None Listed On Document | |
| Warranty Deed | $191,000 | Cascade Title Company | |
| Warranty Deed | $163,900 | Western Title & Escrow Co |
| Date | Status | Loan Amount | Loan Type |
|---|---|---|---|
| Previous Owner | $152,000 | New Conventional | |
| Previous Owner | $131,120 | Purchase Money Mortgage | |
| Closed | $32,780 | No Value Available |
| Date | Event | Price | List to Sale | Price per Sq Ft |
|---|---|---|---|---|
| 10/03/2025 10/03/25 | Sold | $400,000 | -5.9% | $380 / Sq Ft |
| 09/22/2025 09/22/25 | Pending | -- | -- | -- |
| 09/12/2025 09/12/25 | For Sale | $425,000 | +6.3% | $403 / Sq Ft |
| 09/11/2025 09/11/25 | Off Market | $400,000 | -- | -- |
| 09/10/2025 09/10/25 | Price Changed | $425,000 | -2.3% | $403 / Sq Ft |
| 08/01/2025 08/01/25 | For Sale | $435,000 | -- | $413 / Sq Ft |
| Year | Tax Paid | Tax Assessment Tax Assessment Total Assessment is a certain percentage of the fair market value that is determined by local assessors to be the total taxable value of land and additions on the property. | Land | Improvement |
|---|---|---|---|---|
| 2025 | $4,010 | $205,830 | -- | -- |
| 2024 | $3,960 | $199,835 | -- | -- |
| 2023 | $3,960 | $194,015 | -- | -- |
| 2022 | $3,710 | $188,365 | $0 | $0 |
| 2021 | $3,485 | $182,879 | $0 | $0 |
| 2020 | $3,497 | $177,553 | $0 | $0 |
| 2019 | $3,378 | $172,382 | $0 | $0 |
| 2018 | $3,179 | $162,487 | $0 | $0 |
| 2017 | $3,035 | $162,487 | $0 | $0 |
| 2016 | $2,906 | $157,754 | $0 | $0 |
| 2015 | $2,778 | $153,159 | $0 | $0 |
| 2014 | $2,452 | $137,436 | $0 | $0 |
Seller's Agent in 2025
Colin Call
RE/MAX
(541) 579-1615
13 in this area
95 Total Sales
Buyer's Agent in 2025
Kim Heddinger
Golden Realty
(541) 343-8269
2 in this area
68 Total Sales
Source: Regional Multiple Listing Service (RMLS)
MLS Number: 260172180
APN: 0155422
Disclaimer: Certain information contained herein is derived from information provided by parties other than Homes.com. All information provided is deemed reliable, but is not guaranteed to be accurate and should be independently verified.
![]() The content relating to real estate for sale on this web site comes in part from the IDX program of the RMLS™ of Portland, Oregon. Real estate listings held by brokerage firms other than Ten-X are marked with the RMLS™ logo, and detailed information about these properties includes the names of the listing brokers. Listing content is copyright © 2026 RMLS™, Portland, Oregon. Some properties which appear for sale on this web site may subsequently have sold or may no longer be available. All information provided is deemed reliable but is not guaranteed and should be independently verified.
The content relating to real estate for sale on this web site comes in part from the IDX program of the RMLS™ of Portland, Oregon. Real estate listings held by brokerage firms other than Ten-X are marked with the RMLS™ logo, and detailed information about these properties includes the names of the listing brokers. Listing content is copyright © 2026 RMLS™, Portland, Oregon. Some properties which appear for sale on this web site may subsequently have sold or may no longer be available. All information provided is deemed reliable but is not guaranteed and should be independently verified.
Ask me questions while you tour the home.