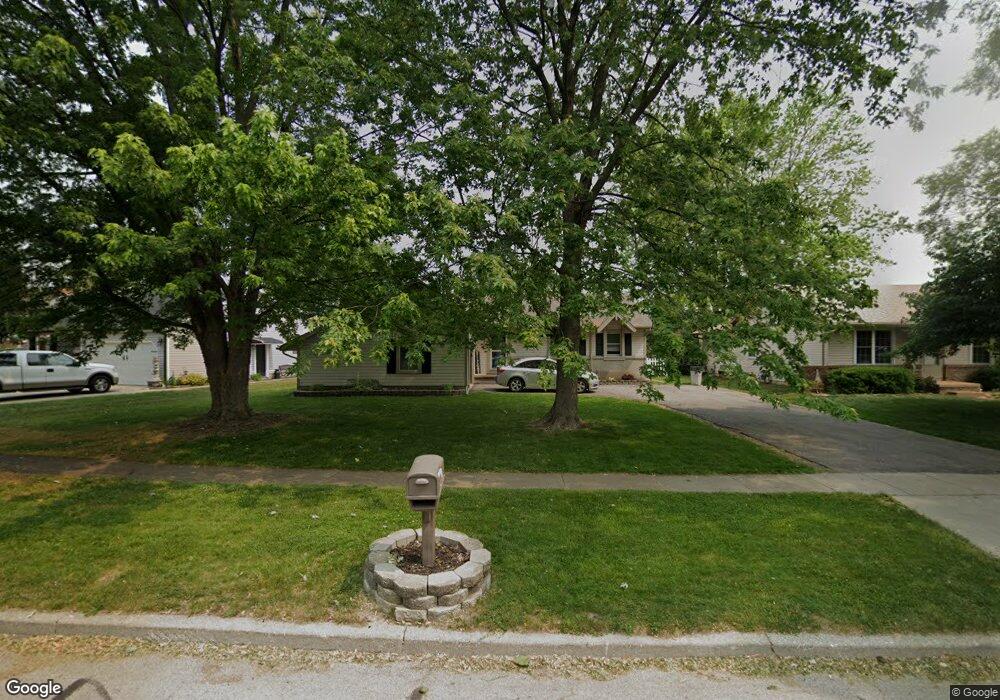
2465 Point Pleasant Way Toledo, OH 43611
Shoreland NeighborhoodEstimated Value: $208,354 - $226,000
3
Beds
2
Baths
1,440
Sq Ft
$151/Sq Ft
Est. Value
About This Home
This home is located at 2465 Point Pleasant Way, Toledo, OH 43611 and is currently estimated at $217,839, approximately $151 per square foot. 2465 Point Pleasant Way is a home located in Lucas County with nearby schools including Shoreland Elementary School, Washington Junior High School, and Jefferson Junior High School.
Ownership History
Date
Name
Owned For
Owner Type
Purchase Details
Closed on
Dec 19, 2017
Sold by
Chetcuti Norman
Bought by
Mustafaga Karl S and Mustafaga Michelle L
Current Estimated Value
Home Financials for this Owner
Home Financials are based on the most recent Mortgage that was taken out on this home.
Original Mortgage
$128,135
Outstanding Balance
$109,134
Interest Rate
4.4%
Mortgage Type
FHA
Estimated Equity
$108,705
Purchase Details
Closed on
Oct 25, 1999
Sold by
Nicholas Janet M
Bought by
Chetcuti Norman
Home Financials for this Owner
Home Financials are based on the most recent Mortgage that was taken out on this home.
Original Mortgage
$84,000
Interest Rate
7.91%
Purchase Details
Closed on
Nov 15, 1989
Sold by
Yeackel Harry
Create a Home Valuation Report for This Property
The Home Valuation Report is an in-depth analysis detailing your home's value as well as a comparison with similar homes in the area
Home Values in the Area
Average Home Value in this Area
Purchase History
| Date | Buyer | Sale Price | Title Company |
|---|---|---|---|
| Mustafaga Karl S | $130,500 | None Available | |
| Chetcuti Norman | $105,000 | American 1St | |
| -- | -- | -- |
Source: Public Records
Mortgage History
| Date | Status | Borrower | Loan Amount |
|---|---|---|---|
| Open | Mustafaga Karl S | $128,135 | |
| Closed | Chetcuti Norman | $84,000 |
Source: Public Records
Tax History Compared to Growth
Tax History
| Year | Tax Paid | Tax Assessment Tax Assessment Total Assessment is a certain percentage of the fair market value that is determined by local assessors to be the total taxable value of land and additions on the property. | Land | Improvement |
|---|---|---|---|---|
| 2024 | $1,742 | $49,490 | $9,870 | $39,620 |
| 2023 | $3,637 | $43,295 | $8,155 | $35,140 |
| 2022 | $3,631 | $43,295 | $8,155 | $35,140 |
| 2021 | $3,637 | $43,295 | $8,155 | $35,140 |
| 2020 | $3,462 | $35,455 | $6,720 | $28,735 |
| 2019 | $3,390 | $35,455 | $6,720 | $28,735 |
| 2018 | $3,043 | $35,455 | $6,720 | $28,735 |
| 2017 | $2,997 | $31,500 | $5,285 | $26,215 |
| 2016 | $2,963 | $90,000 | $15,100 | $74,900 |
| 2015 | $2,950 | $90,000 | $15,100 | $74,900 |
| 2014 | $2,588 | $31,510 | $5,290 | $26,220 |
| 2013 | $2,588 | $31,510 | $5,290 | $26,220 |
Source: Public Records
Map
Nearby Homes
- 2441 Point Pleasant Way
- 5960 Vistamar Rd
- 5516 Fortune Dr
- 5531 Ottawa River Rd
- 5433 Brophy Dr
- 6337 Grandview Dr
- 6233 Grandview Dr
- 5331 Whitehouse Dr
- 5414 303rd St
- 5534 Suder Ave
- 2642 124th St
- 3150 Shoreland Ave
- 2716 122nd St
- 5338 305th St
- 3028 Morin Point St
- 2240 Ruthanne Dr
- 3045 129th St
- 2835 121st St
- 5457 Thornbrook Trail
- 2749 119th St
- 2507 Point Pleasant Way
- 2457 Point Pleasant Way
- 2513 Point Pleasant Way
- 2453 Point Pleasant Way
- 2468 Point Pleasant Way
- 2462 Point Pleasant Way
- 2519 Point Pleasant Way
- 2456 Point Pleasant Way
- 2516 Point Pleasant Way
- 2447 Point Pleasant Way
- 2527 Point Pleasant Way
- 2450 Point Pleasant Way
- 5961 Rounding River Ln
- 2522 Point Pleasant Way
- 2442 Point Pleasant Way
- 2533 Point Pleasant Way
- 2515 Redfox Dr
- 2528 Point Pleasant Way
- 5956 Water Point Ct
- 2446 Point Pleasant Way