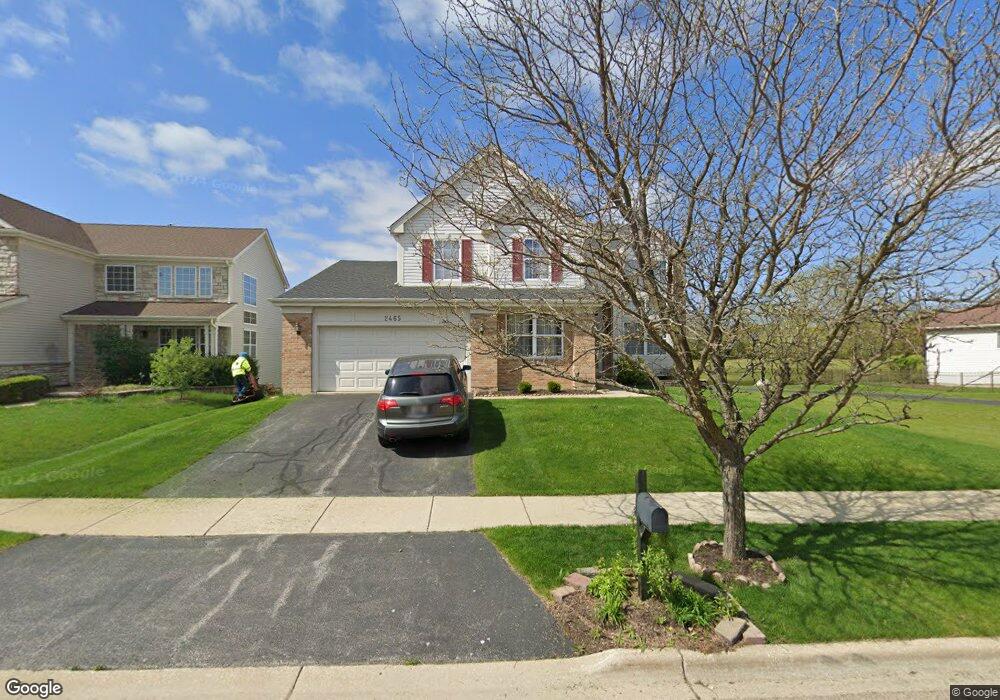
2465 Wydown Ln Aurora, IL 60502
Big Woods Marmion NeighborhoodEstimated Value: $586,000 - $633,000
4
Beds
3
Baths
3,010
Sq Ft
$204/Sq Ft
Est. Value
About This Home
This home is located at 2465 Wydown Ln, Aurora, IL 60502 and is currently estimated at $614,209, approximately $204 per square foot. 2465 Wydown Ln is a home located in DuPage County with nearby schools including Gwendolyn Brooks Elementary School, Francis Granger Middle School, and Metea Valley High School.
Ownership History
Date
Name
Owned For
Owner Type
Purchase Details
Closed on
Aug 18, 2021
Sold by
Achanta Prabhakarrao
Bought by
Achanta Gopinath and Achanta Bindu Madhavi
Current Estimated Value
Home Financials for this Owner
Home Financials are based on the most recent Mortgage that was taken out on this home.
Original Mortgage
$353,600
Outstanding Balance
$268,582
Interest Rate
2.2%
Mortgage Type
New Conventional
Estimated Equity
$345,627
Purchase Details
Closed on
Sep 4, 2001
Sold by
Drh Cambridge Homes Inc
Bought by
Achanta Prabhakarrao
Home Financials for this Owner
Home Financials are based on the most recent Mortgage that was taken out on this home.
Original Mortgage
$244,800
Interest Rate
6.69%
Mortgage Type
Purchase Money Mortgage
Create a Home Valuation Report for This Property
The Home Valuation Report is an in-depth analysis detailing your home's value as well as a comparison with similar homes in the area
Home Values in the Area
Average Home Value in this Area
Purchase History
| Date | Buyer | Sale Price | Title Company |
|---|---|---|---|
| Achanta Gopinath | $450,000 | National Title Solutions Inc | |
| Achanta Prabhakarrao | $306,500 | First American Title |
Source: Public Records
Mortgage History
| Date | Status | Borrower | Loan Amount |
|---|---|---|---|
| Open | Achanta Gopinath | $353,600 | |
| Previous Owner | Achanta Prabhakarrao | $244,800 |
Source: Public Records
Tax History
| Year | Tax Paid | Tax Assessment Tax Assessment Total Assessment is a certain percentage of the fair market value that is determined by local assessors to be the total taxable value of land and additions on the property. | Land | Improvement |
|---|---|---|---|---|
| 2024 | $12,136 | $167,614 | $35,591 | $132,023 |
| 2023 | $11,590 | $150,610 | $31,980 | $118,630 |
| 2022 | $11,970 | $148,740 | $31,320 | $117,420 |
| 2021 | $12,168 | $143,430 | $30,200 | $113,230 |
| 2020 | $12,316 | $143,430 | $30,200 | $113,230 |
| 2019 | $11,917 | $136,410 | $28,720 | $107,690 |
| 2018 | $11,910 | $134,840 | $28,070 | $106,770 |
| 2017 | $11,737 | $130,270 | $27,120 | $103,150 |
| 2016 | $11,560 | $125,020 | $26,030 | $98,990 |
| 2015 | $11,482 | $118,700 | $24,710 | $93,990 |
| 2014 | $10,716 | $107,550 | $22,220 | $85,330 |
| 2013 | $10,599 | $108,290 | $22,370 | $85,920 |
Source: Public Records
Map
Nearby Homes
- 2376 Foxmoor Ln Unit 5443
- 2242 Foxmoor Ln Unit 5182
- 2667 Charter Oak Dr
- 2615 Prairieview Ln
- 2630 White Barn Rd
- 2331 Handley Ln
- 2819 Clarissa Ln
- 2482 Hedge Row Dr
- 2315 Nan St
- 2940 Arbor Ln
- 2762 Shetland Ln
- 2045 Stuttle Rd
- 2049 Stuttle Rd
- 1600 Harris Dr
- 1870 Tall Oaks Dr Unit 2104
- 1942 Tall Oaks Dr Unit 3B
- 2428 Ridgewood Ct
- 2047 Swan Ln
- 1751 Gary Ave
- 1283 Cranbrook Cir Unit 38
- 2473 Wydown Ln
- 2481 Wydown Ln Unit 4
- 2468 Wydown Ln Unit 4
- 2484 Wydown Ln Unit 4
- 2441 Wydown Ln Unit 4
- 2444 Wydown Ln Unit 4
- 2489 Wydown Ln Unit 4
- 2433 Wydown Ln Unit 4
- 2492 Wydown Ln
- 2436 Wydown Ln Unit 4
- 2393 White Barn Rd
- 2497 Wydown Ln Unit 4
- 2392 White Barn Rd Unit 4
- 2359 Forsyth Ln
- 2428 Wydown Ln Unit 4
- 2505 Wydown Ln Unit 4
- 2500 Wydown Ln Unit 4
- 2399 White Barn Rd Unit 4
- 2377 Forsyth Ln
- 2398 White Barn Rd
Your Personal Tour Guide
Ask me questions while you tour the home.