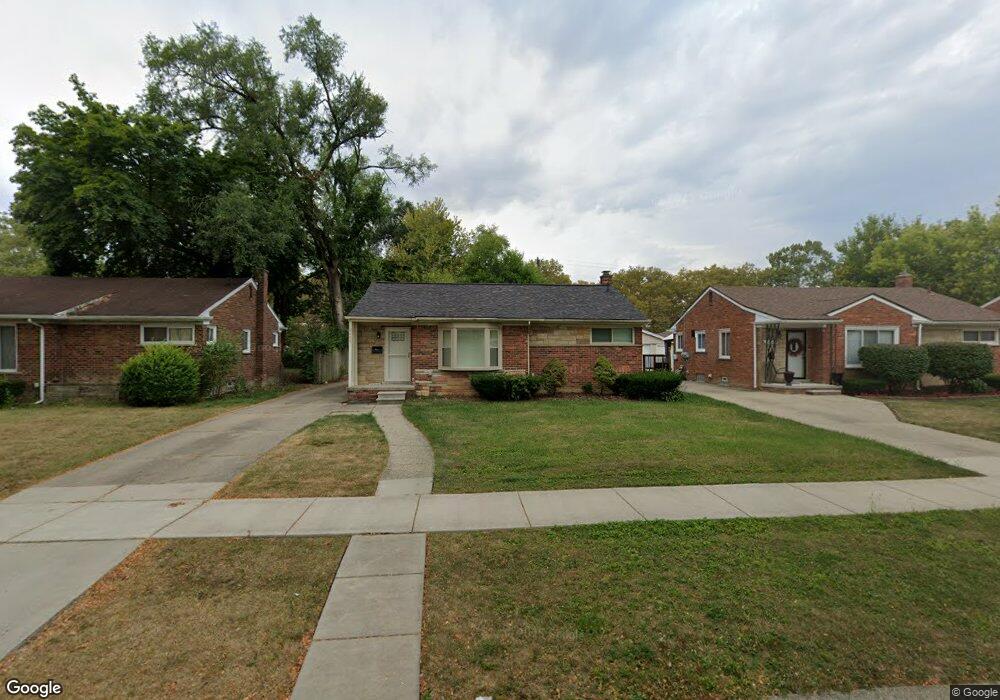
24651 Kenosha St Oak Park, MI 48237
Estimated Value: $195,000 - $226,000
3
Beds
1
Bath
1,006
Sq Ft
$209/Sq Ft
Est. Value
About This Home
This home is located at 24651 Kenosha St, Oak Park, MI 48237 and is currently estimated at $210,615, approximately $209 per square foot. 24651 Kenosha St is a home located in Oakland County with nearby schools including Pepper Elementary School, Crescent Academy - High School, and Beth Jacob 1-8.
Ownership History
Date
Name
Owned For
Owner Type
Purchase Details
Closed on
Jul 16, 2024
Sold by
Ramzi Properties 1 Llc
Bought by
Brown Christopher Lamont
Current Estimated Value
Purchase Details
Closed on
Sep 27, 2016
Sold by
Thomas Properties 5 Llc
Bought by
Ramzi Properties 1 Llc
Purchase Details
Closed on
Mar 6, 2007
Sold by
Thomas Greg
Bought by
Thomas Properties #5 Llc
Purchase Details
Closed on
Jul 7, 2003
Sold by
Sanders Ollie
Bought by
Thomas Greg
Home Financials for this Owner
Home Financials are based on the most recent Mortgage that was taken out on this home.
Original Mortgage
$67,500
Interest Rate
4.75%
Mortgage Type
Purchase Money Mortgage
Purchase Details
Closed on
Oct 13, 1995
Sold by
Forman Saul
Bought by
Sanders Ollie
Home Financials for this Owner
Home Financials are based on the most recent Mortgage that was taken out on this home.
Original Mortgage
$47,250
Interest Rate
7.65%
Create a Home Valuation Report for This Property
The Home Valuation Report is an in-depth analysis detailing your home's value as well as a comparison with similar homes in the area
Home Values in the Area
Average Home Value in this Area
Purchase History
| Date | Buyer | Sale Price | Title Company |
|---|---|---|---|
| Brown Christopher Lamont | $190,000 | None Listed On Document | |
| Brown Christopher Lamont | $190,000 | None Listed On Document | |
| Ramzi Properties 1 Llc | -- | None Available | |
| Thomas Properties #5 Llc | -- | None Available | |
| Thomas Greg | $90,000 | Title First Agency Mi Llc | |
| Sanders Ollie | $67,500 | -- |
Source: Public Records
Mortgage History
| Date | Status | Borrower | Loan Amount |
|---|---|---|---|
| Previous Owner | Thomas Greg | $67,500 | |
| Previous Owner | Sanders Ollie | $47,250 |
Source: Public Records
Tax History Compared to Growth
Tax History
| Year | Tax Paid | Tax Assessment Tax Assessment Total Assessment is a certain percentage of the fair market value that is determined by local assessors to be the total taxable value of land and additions on the property. | Land | Improvement |
|---|---|---|---|---|
| 2024 | $4,189 | $79,200 | $14,300 | $64,900 |
| 2023 | $4,018 | $69,700 | $13,300 | $56,400 |
| 2022 | $1,422 | $60,000 | $10,800 | $49,200 |
| 2021 | $1,845 | $50,400 | $5,600 | $44,800 |
| 2020 | $1,796 | $44,200 | $5,600 | $38,600 |
| 2018 | $1,787 | $30,000 | $0 | $0 |
| 2015 | -- | $23,700 | $0 | $0 |
| 2014 | -- | $21,300 | $0 | $0 |
| 2011 | -- | $28,600 | $0 | $0 |
Source: Public Records
Map
Nearby Homes
- 14221 W 10 Mile Rd
- 24761 Church St
- 24691 Parklawn St
- 24211 Kenosha St
- 24221 Cloverlawn St
- 25200 Gardner St
- 24251 Westhampton St
- 15030 Bishop St
- 24730 Ridgedale St
- 24131 Stratford St
- 15201 Marlow St
- 23711 Coyle St
- 14072 Ludlow St
- 15121 Oak Park Blvd
- 24260 Coolidge Hwy
- 23621 Marlow St
- 13369 Winchester Ave
- 14420 Vernon St
- 23530 Gardner St
- 13340 Dartmouth St
- 24661 Kenosha St
- 24641 Kenosha St
- 24671 Kenosha St
- 24631 Kenosha St
- 24650 Church St
- 24660 Church St
- 24640 Church St
- 24681 Kenosha St
- 24621 Kenosha St
- 24630 Church St
- 24650 Kenosha St
- 24640 Kenosha St
- 24660 Kenosha St
- 24680 Church St
- 24620 Church St
- 24701 Kenosha St
- 24630 Kenosha St
- 24670 Kenosha St
- 24700 Church St
- 24610 Church St