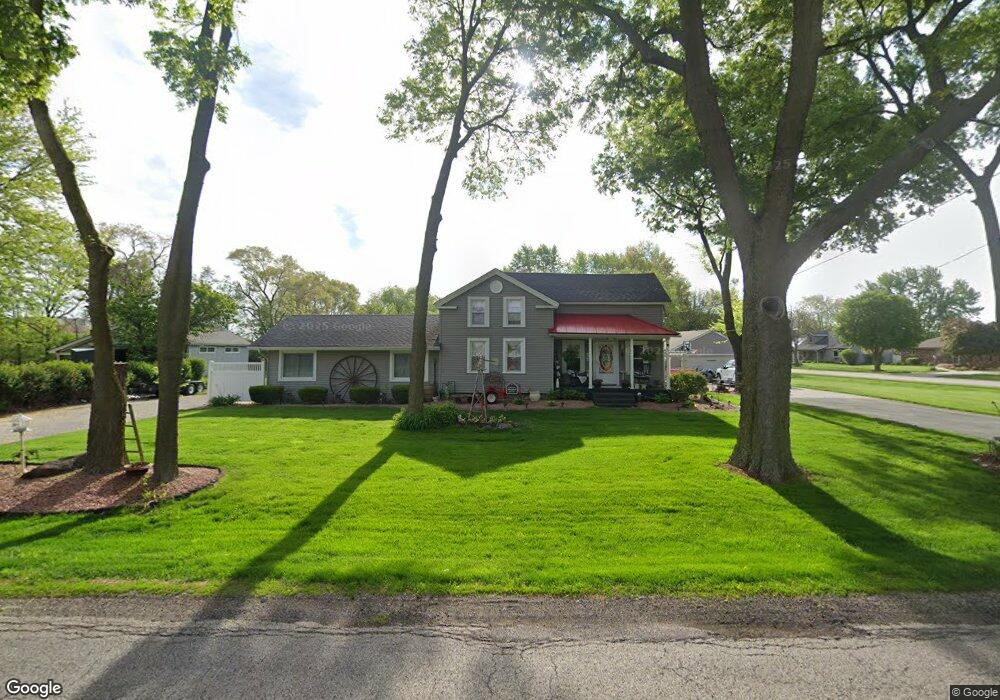
24659 S Tryon St Channahon, IL 60410
Estimated Value: $279,116 - $411,000
--
Bed
--
Bath
2,082
Sq Ft
$162/Sq Ft
Est. Value
About This Home
This home is located at 24659 S Tryon St, Channahon, IL 60410 and is currently estimated at $337,279, approximately $161 per square foot. 24659 S Tryon St is a home located in Will County with nearby schools including N B Galloway Elementary School, Pioneer Path School, and Three Rivers School.
Ownership History
Date
Name
Owned For
Owner Type
Purchase Details
Closed on
Jan 23, 2012
Sold by
County Of Will
Bought by
Saltzman Michael and Saltzman Kathleen
Current Estimated Value
Purchase Details
Closed on
Aug 20, 2011
Sold by
Harris Bank Joliet Na Tr 1212
Bought by
County Of Will
Purchase Details
Closed on
Apr 6, 1998
Sold by
Saltzman Ella Mae and Walton Ella Mae
Bought by
Saltzman Mike W and Saltzman Kathleen M
Purchase Details
Closed on
Dec 24, 1994
Sold by
First National Bank Of Joliet
Bought by
Saltzman Mike M and Saltzman Kathleen M
Home Financials for this Owner
Home Financials are based on the most recent Mortgage that was taken out on this home.
Original Mortgage
$92,000
Interest Rate
9.23%
Create a Home Valuation Report for This Property
The Home Valuation Report is an in-depth analysis detailing your home's value as well as a comparison with similar homes in the area
Home Values in the Area
Average Home Value in this Area
Purchase History
| Date | Buyer | Sale Price | Title Company |
|---|---|---|---|
| Saltzman Michael | -- | None Available | |
| County Of Will | -- | None Available | |
| Saltzman Mike W | -- | -- | |
| Saltzman Mike M | -- | Greater Illinois Title Compa |
Source: Public Records
Mortgage History
| Date | Status | Borrower | Loan Amount |
|---|---|---|---|
| Previous Owner | Saltzman Mike M | $92,000 |
Source: Public Records
Tax History Compared to Growth
Tax History
| Year | Tax Paid | Tax Assessment Tax Assessment Total Assessment is a certain percentage of the fair market value that is determined by local assessors to be the total taxable value of land and additions on the property. | Land | Improvement |
|---|---|---|---|---|
| 2024 | $6,286 | $90,544 | $15,318 | $75,226 |
| 2023 | $6,286 | $79,951 | $13,526 | $66,425 |
| 2022 | $5,503 | $74,980 | $12,685 | $62,295 |
| 2021 | $5,116 | $70,870 | $11,990 | $58,880 |
| 2020 | $4,948 | $69,345 | $11,732 | $57,613 |
| 2019 | $4,685 | $67,000 | $11,200 | $55,800 |
| 2018 | $4,830 | $62,626 | $10,325 | $52,301 |
| 2017 | $4,708 | $60,044 | $9,899 | $50,145 |
| 2016 | $4,557 | $57,624 | $9,500 | $48,124 |
| 2015 | $4,087 | $52,800 | $8,500 | $44,300 |
| 2014 | $4,087 | $52,200 | $8,500 | $43,700 |
| 2013 | $4,087 | $52,200 | $8,500 | $43,700 |
Source: Public Records
Map
Nearby Homes
- 24758 S Tryon St
- 25225 W Saint Elizabeth Dr Unit B32
- 25221 W Saint Elizabeth Dr Unit B33
- 25215 W Saint Elizabeth Dr Unit B34
- 25211 W Saint Elizabeth Dr Unit B35
- 25205 W Saint Elizabeth Dr Unit B36
- 24639 S Howard Ct
- 24605 S River Trail
- 25640 Mohawk Ln
- Sec8 W Eames St
- 25200 W Pawnee Ln
- 24025 Timberwood Dr
- 26020 W Ravine Woods Dr
- 24530 W Bluff Rd
- 218 San Carlos Rd
- 220 Santos Ave
- 25540 S Canal St
- 23836 S Willow Ln
- 24123 S Sandpiper Dr
- 24415 W Quail Dr
- 25338 W Channon Dr
- 24637 S Tryon St
- 24654 S Tryon St
- 24648 S Tryon St
- 24709 S Tryon St
- 24660 S Tryon St
- 25349 W Channon Dr
- 24706 S Tryon St
- 24640 S Tryon St
- 25326 W Channon Dr
- 25337 W Channon Dr
- 24714 S Tryon St
- 24621 S Tryon St
- 25424 W Knapp St
- 24719 S Tryon St
- 25327 W Channon Dr
- 24630 S Tryon St
- 25312 W Channon Dr
- 24729 S Tryon St