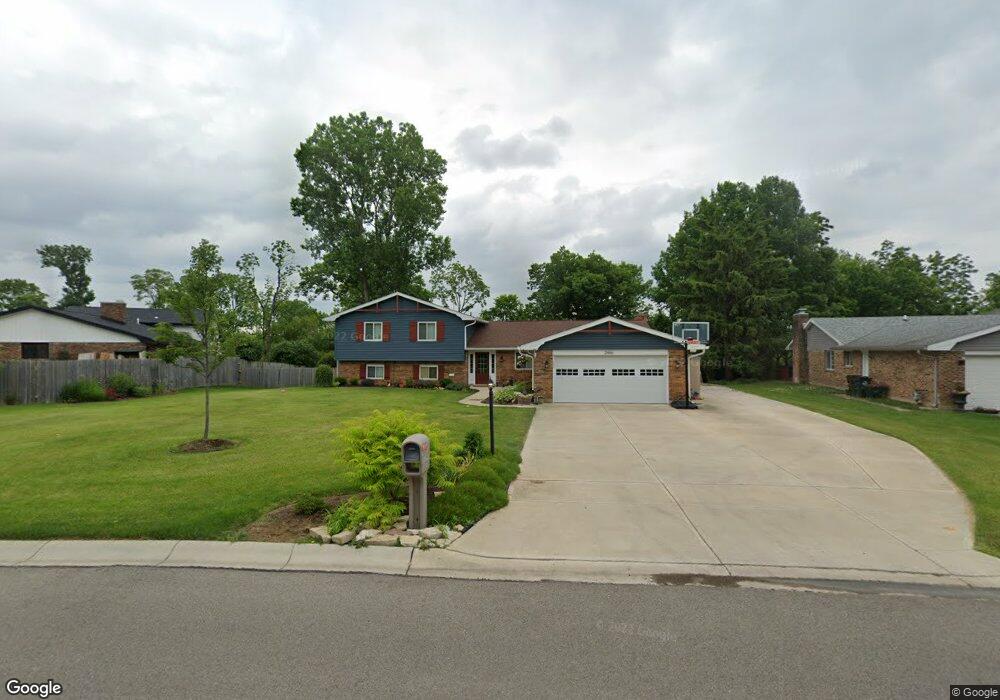
2466 Glenboro Dr Beavercreek, OH 45431
Estimated Value: $402,770 - $428,000
6
Beds
4
Baths
2,982
Sq Ft
$139/Sq Ft
Est. Value
About This Home
This home is located at 2466 Glenboro Dr, Beavercreek, OH 45431 and is currently estimated at $414,693, approximately $139 per square foot. 2466 Glenboro Dr is a home located in Greene County with nearby schools including Shaw Elementary School, Jacob Coy Middle School, and Beavercreek High School.
Ownership History
Date
Name
Owned For
Owner Type
Purchase Details
Closed on
Oct 30, 2018
Sold by
Rempes Richard C and Rempes Jayne E
Bought by
Scholz Matthew S and Scholz Amanda E
Current Estimated Value
Home Financials for this Owner
Home Financials are based on the most recent Mortgage that was taken out on this home.
Original Mortgage
$229,500
Outstanding Balance
$144,971
Interest Rate
4.8%
Mortgage Type
New Conventional
Estimated Equity
$269,722
Purchase Details
Closed on
Feb 28, 2001
Sold by
Haas David D
Bought by
Rempes Richard C and Rempes Jayne E
Home Financials for this Owner
Home Financials are based on the most recent Mortgage that was taken out on this home.
Original Mortgage
$144,000
Interest Rate
7.18%
Purchase Details
Closed on
Jul 30, 1996
Sold by
Priestley Janice
Bought by
Haas David D
Home Financials for this Owner
Home Financials are based on the most recent Mortgage that was taken out on this home.
Original Mortgage
$132,050
Interest Rate
6.75%
Mortgage Type
New Conventional
Create a Home Valuation Report for This Property
The Home Valuation Report is an in-depth analysis detailing your home's value as well as a comparison with similar homes in the area
Home Values in the Area
Average Home Value in this Area
Purchase History
| Date | Buyer | Sale Price | Title Company |
|---|---|---|---|
| Scholz Matthew S | $255,000 | None Available | |
| Rempes Richard C | $180,000 | -- | |
| Haas David D | $139,000 | -- |
Source: Public Records
Mortgage History
| Date | Status | Borrower | Loan Amount |
|---|---|---|---|
| Open | Scholz Matthew S | $229,500 | |
| Previous Owner | Rempes Richard C | $144,000 | |
| Previous Owner | Haas David D | $132,050 |
Source: Public Records
Tax History Compared to Growth
Tax History
| Year | Tax Paid | Tax Assessment Tax Assessment Total Assessment is a certain percentage of the fair market value that is determined by local assessors to be the total taxable value of land and additions on the property. | Land | Improvement |
|---|---|---|---|---|
| 2024 | $7,058 | $108,090 | $22,470 | $85,620 |
| 2023 | $7,058 | $108,090 | $22,470 | $85,620 |
| 2022 | $6,107 | $82,570 | $18,730 | $63,840 |
| 2021 | $5,983 | $82,570 | $18,730 | $63,840 |
| 2020 | $6,028 | $82,570 | $18,730 | $63,840 |
| 2019 | $5,989 | $74,780 | $12,810 | $61,970 |
| 2018 | $5,287 | $74,780 | $12,810 | $61,970 |
| 2017 | $5,446 | $74,780 | $12,810 | $61,970 |
| 2016 | $5,447 | $74,750 | $12,810 | $61,940 |
| 2015 | $5,415 | $74,750 | $12,810 | $61,940 |
| 2014 | $5,333 | $74,750 | $12,810 | $61,940 |
Source: Public Records
Map
Nearby Homes
- 3602 Queen Victoria Ct
- 3611 King Edward Way
- 2402 Spicer Dr
- 2690 Gardenia Ave Unit 6
- 2212 Tulane Dr
- 3752 Grant Ave Unit P
- 2699 Golden Leaf Dr Unit 19-203
- 3331 Home Acres Ave
- 2745 Golden Leaf Dr Unit 18-303
- 3951 La Bonne Rd
- 3976 Graham Dr
- 3653 Knollwood Dr
- 2146 Oxmoor Dr
- 3189 Claydor Dr
- 2982 Idaho Falls Dr
- 2629 Morning Sun Dr
- 1873 Turnbull Rd
- 2110 Grange Hall Rd
- 2930 Coldwater Ct
- 1946 N Longview St
- 2456 Glenboro Dr
- 3500 Fullerton Ct
- 2446 Glenboro Dr
- 2465 Glenboro Dr
- 3510 Fullerton Ct
- 2451 Glenboro Dr
- 2473 Queen Elizabeth Ct
- 2436 Glenboro Dr
- 3541 Old Oaks Dr
- 3526 Fullerton Ct
- 2479 Queen Elizabeth Ct
- 3518 Fullerton Ct
- 2441 Glenboro Dr
- 2469 Queen Elizabeth Ct
- 2465 Flyway Ct
- 2485 Queen Elizabeth Ct
- 2426 Glenboro Dr
- 3538 Old Oaks Dr
- 2435 Flyway Ct
- 2449 Flyway Ct