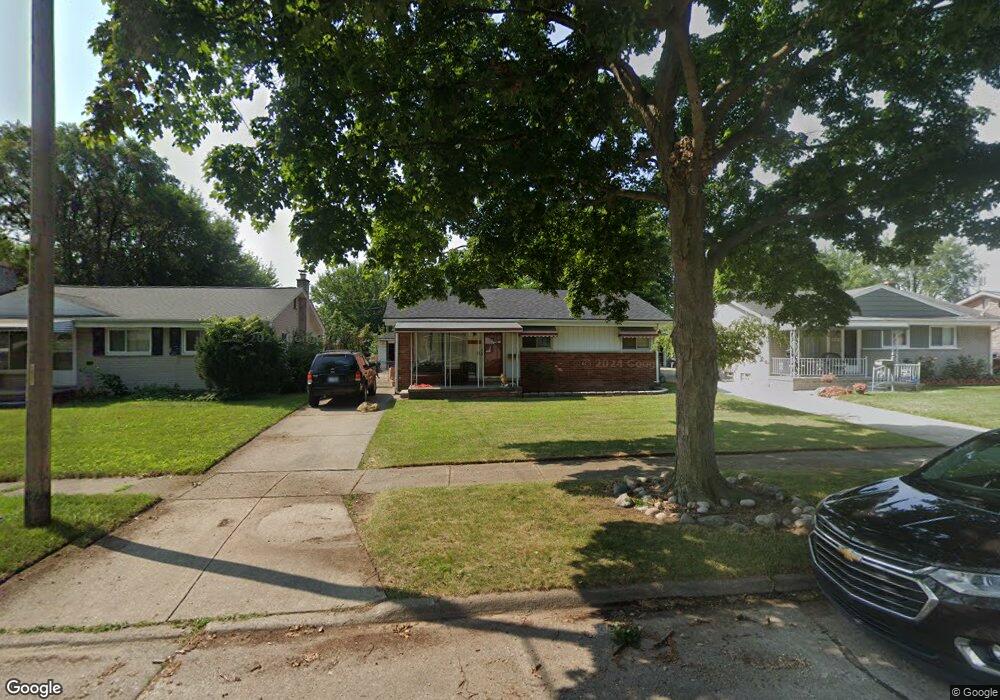
24665 McDonald St Dearborn Heights, MI 48125
Estimated Value: $163,000 - $179,000
--
Bed
1
Bath
986
Sq Ft
$174/Sq Ft
Est. Value
About This Home
This home is located at 24665 McDonald St, Dearborn Heights, MI 48125 and is currently estimated at $171,104, approximately $173 per square foot. 24665 McDonald St is a home located in Wayne County with nearby schools including West Village Academy and Quest Charter Academy.
Ownership History
Date
Name
Owned For
Owner Type
Purchase Details
Closed on
Mar 21, 2022
Sold by
Tina Stephanoff
Bought by
Stephanoff Tina and Stephanoff Thomas
Current Estimated Value
Home Financials for this Owner
Home Financials are based on the most recent Mortgage that was taken out on this home.
Original Mortgage
$104,500
Outstanding Balance
$84,632
Interest Rate
3.39%
Mortgage Type
New Conventional
Estimated Equity
$86,472
Purchase Details
Closed on
Oct 7, 2003
Sold by
Benn David and Benn Jessica
Bought by
Stepharoff Tina
Purchase Details
Closed on
Mar 11, 2003
Sold by
Ronewicz Donald and Benn David
Bought by
Benn David A
Home Financials for this Owner
Home Financials are based on the most recent Mortgage that was taken out on this home.
Original Mortgage
$117,000
Interest Rate
5.71%
Mortgage Type
Purchase Money Mortgage
Purchase Details
Closed on
Jun 12, 1998
Sold by
Farq Kevin J and Farq Suzanne M
Bought by
Benn David
Create a Home Valuation Report for This Property
The Home Valuation Report is an in-depth analysis detailing your home's value as well as a comparison with similar homes in the area
Home Values in the Area
Average Home Value in this Area
Purchase History
| Date | Buyer | Sale Price | Title Company |
|---|---|---|---|
| Stephanoff Tina | -- | Rosenberg Pllc | |
| Stepharoff Tina | $150,000 | Stewart Title | |
| Benn David A | -- | First Michigan Title Inc | |
| Benn David | $91,000 | -- |
Source: Public Records
Mortgage History
| Date | Status | Borrower | Loan Amount |
|---|---|---|---|
| Open | Stephanoff Tina | $104,500 | |
| Previous Owner | Benn David A | $117,000 |
Source: Public Records
Tax History Compared to Growth
Tax History
| Year | Tax Paid | Tax Assessment Tax Assessment Total Assessment is a certain percentage of the fair market value that is determined by local assessors to be the total taxable value of land and additions on the property. | Land | Improvement |
|---|---|---|---|---|
| 2025 | $1,384 | $76,800 | $0 | $0 |
| 2024 | $1,384 | $69,600 | $0 | $0 |
| 2023 | $1,243 | $60,400 | $0 | $0 |
| 2022 | $3,532 | $51,900 | $0 | $0 |
| 2021 | $1,903 | $44,600 | $0 | $0 |
| 2019 | $1,878 | $35,100 | $0 | $0 |
| 2018 | $1,511 | $32,100 | $0 | $0 |
| 2017 | $848 | $32,000 | $0 | $0 |
| 2016 | $1,752 | $32,500 | $0 | $0 |
| 2015 | $3,020 | $30,200 | $0 | $0 |
| 2013 | $3,140 | $32,100 | $0 | $0 |
| 2010 | -- | $38,500 | $0 | $0 |
Source: Public Records
Map
Nearby Homes
- 24754 Annapolis St
- 4856 Carolee Ln
- 24727 Hopkins St
- 24443 Powers Ave
- 24360 Pennie St
- 24339 Eton Ave
- 24426 Lehigh St
- 24635 Stanford St
- 24409 Stanford St
- 4147 Westlake St
- 24117 Eton Ave
- 5118 Michael St
- 25118 Lehigh St
- 25243 Lehigh St
- 25212 Lehigh St
- 25085 Colgate St
- 25474 McDonald St
- 24035 Currier St
- 24800 Dartmouth St
- 4489 Westpoint St
- 24675 McDonald St
- 24655 McDonald St
- 24685 McDonald St
- 24645 McDonald St
- 24664 Eton Ave
- 24674 Eton Ave
- 24654 Eton Ave
- 24695 McDonald St
- 24635 McDonald St
- 24684 Eton Ave
- 24644 Eton Ave
- 24694 Eton Ave
- 24666 McDonald St
- 24676 McDonald St
- 24656 McDonald St
- 24705 McDonald St
- 24625 McDonald St
- 24634 Eton Ave
- 24686 McDonald St
- 24646 McDonald St