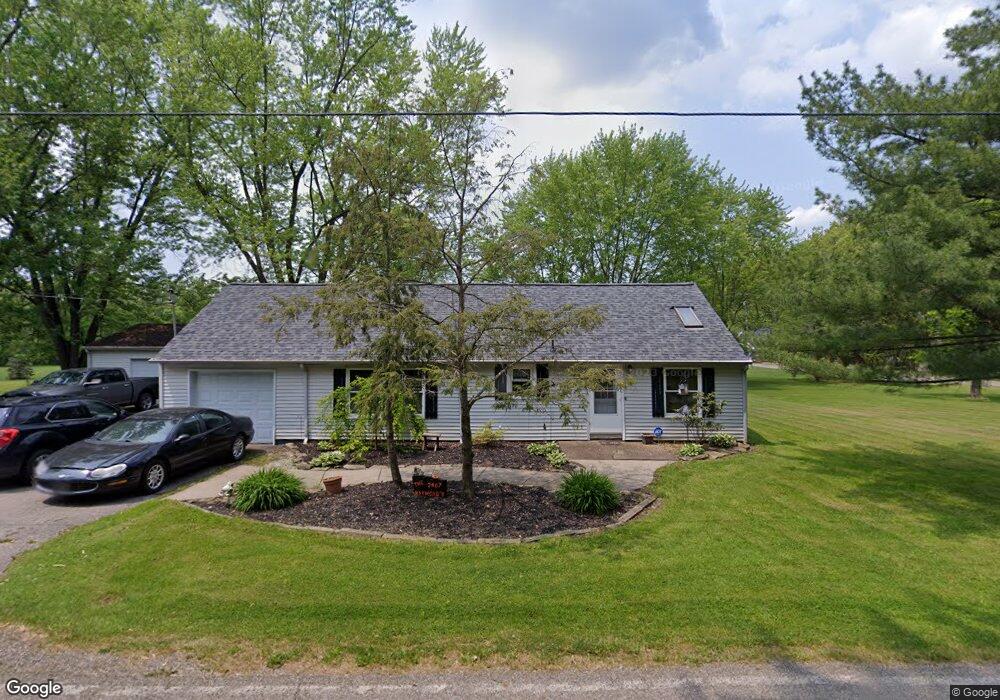
2467 Howland Wilson Rd Cortland, OH 44410
Estimated Value: $189,000 - $220,712
3
Beds
1
Bath
1,296
Sq Ft
$156/Sq Ft
Est. Value
About This Home
This home is located at 2467 Howland Wilson Rd, Cortland, OH 44410 and is currently estimated at $201,678, approximately $155 per square foot. 2467 Howland Wilson Rd is a home located in Trumbull County with nearby schools including Lakeview Elementary School, Lakeview Middle School, and Lakeview High School.
Ownership History
Date
Name
Owned For
Owner Type
Purchase Details
Closed on
Dec 23, 2013
Sold by
Wyndham Kevin P
Bought by
Raymond Shane K
Current Estimated Value
Home Financials for this Owner
Home Financials are based on the most recent Mortgage that was taken out on this home.
Original Mortgage
$70,923
Outstanding Balance
$53,094
Interest Rate
4.25%
Mortgage Type
FHA
Estimated Equity
$148,584
Purchase Details
Closed on
Oct 8, 2010
Sold by
Wyndham Kevin P
Bought by
Raymond Shane K
Home Financials for this Owner
Home Financials are based on the most recent Mortgage that was taken out on this home.
Original Mortgage
$64,900
Interest Rate
5%
Mortgage Type
Seller Take Back
Purchase Details
Closed on
Jan 17, 1997
Sold by
Wyndham Charles R
Bought by
Wyndham Kevin P
Purchase Details
Closed on
Jan 1, 1990
Bought by
Charles Robert
Create a Home Valuation Report for This Property
The Home Valuation Report is an in-depth analysis detailing your home's value as well as a comparison with similar homes in the area
Home Values in the Area
Average Home Value in this Area
Purchase History
| Date | Buyer | Sale Price | Title Company |
|---|---|---|---|
| Raymond Shane K | $79,750 | None Available | |
| Raymond Shane K | $79,900 | None Available | |
| Wyndham Kevin P | $64,800 | -- | |
| Charles Robert | -- | -- |
Source: Public Records
Mortgage History
| Date | Status | Borrower | Loan Amount |
|---|---|---|---|
| Open | Raymond Shane K | $70,923 | |
| Previous Owner | Raymond Shane K | $64,900 |
Source: Public Records
Tax History Compared to Growth
Tax History
| Year | Tax Paid | Tax Assessment Tax Assessment Total Assessment is a certain percentage of the fair market value that is determined by local assessors to be the total taxable value of land and additions on the property. | Land | Improvement |
|---|---|---|---|---|
| 2024 | $2,274 | $45,080 | $8,890 | $36,190 |
| 2023 | $2,274 | $45,080 | $8,890 | $36,190 |
| 2022 | $2,008 | $34,860 | $8,330 | $26,530 |
| 2021 | $2,015 | $34,860 | $8,330 | $26,530 |
| 2020 | $1,992 | $34,270 | $8,330 | $25,940 |
| 2019 | $1,829 | $30,240 | $7,700 | $22,540 |
| 2018 | $1,838 | $30,240 | $7,700 | $22,540 |
| 2017 | $1,834 | $30,240 | $7,700 | $22,540 |
| 2016 | $1,741 | $27,790 | $7,700 | $20,090 |
| 2015 | $1,746 | $27,790 | $7,700 | $20,090 |
| 2014 | $1,608 | $27,790 | $7,700 | $20,090 |
| 2013 | $1,638 | $27,790 | $7,700 | $20,090 |
Source: Public Records
Map
Nearby Homes
- 0 Niles Ashtabula Rd Unit 5147189
- 2271 Saddlebrook Ln
- 0 Muir Woods Dr
- Lot 4 N Gulch Ln
- 5 Oh-46
- 4 Niles Cortland Rd NE
- 0 #3 Niles Cortland Rd- Sr 46 Unit 4274646
- 1 Oh-46
- 0 Niles Cortland Rd Sr 46 Unit 4273262
- 2760 Ravine Run
- 3233 Niles Cortland Rd NE
- 2133 Silver Fox Ln NE
- 0 Black Duck Ct Unit 5133669
- 0 Black Duck Ct Unit 5088418
- 126 N Aspen Ct Unit 2
- 3262 Pheasant Run Rd Unit B
- 2730 Wilson Sharpsville Rd
- 106 N Aspen Ct Unit 4
- 3258 Woodland Trail Unit B
- 3248 Woodland Trail
- 2462 Howland Wilson Rd
- 2601 Howland Wilson Rd
- 2838 Howland Wilson Rd
- 2525 Howland Wilson Rd
- 2551 Howland Wilson Rd
- 2574 Cadwallader Sonk Rd
- 2585 Cadwallader Sonk Rd
- 2428 Howland Wilson Rd
- 2613 Cadwallader Sonk Rd
- 2554 Cadwallader Sonk Rd Unit R
- 2565 Cadwallader Sonk Rd
- 2540 Cadwallader Sonk Rd
- 2635 Cadwallader Sonk Rd
- 2399 Howland Wilson Rd
- 2531 Cadwallader Sonk Rd
- 2413 Howland Wilson Rd
- 2510 Cadwallader Sonk Rd
- 2515 Cadwallader Sonk Rd
- 2683 Cadwallader Sonk Rd
- 2490 Cadwallader Sonk Rd