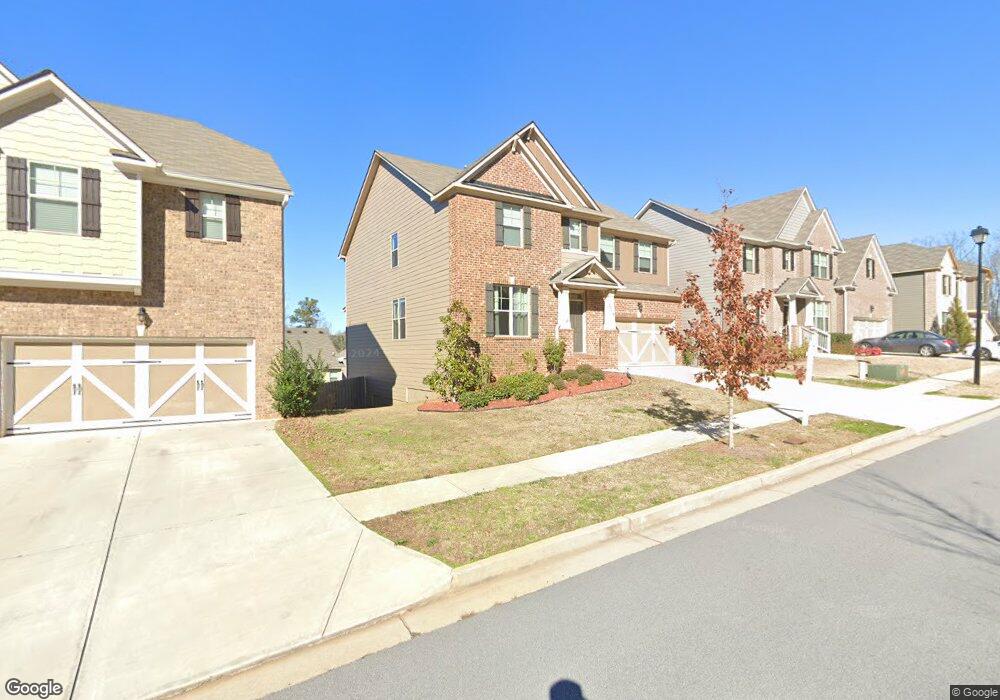
2468 Beauchamp Ct Unit 97 Buford, GA 30519
Estimated Value: $532,000 - $591,000
4
Beds
3
Baths
3,054
Sq Ft
$181/Sq Ft
Est. Value
About This Home
This home is located at 2468 Beauchamp Ct Unit 97, Buford, GA 30519 and is currently estimated at $553,190, approximately $181 per square foot. 2468 Beauchamp Ct Unit 97 is a home located in Gwinnett County with nearby schools including Harmony Elementary School and Glenn C. Jones Middle School.
Ownership History
Date
Name
Owned For
Owner Type
Purchase Details
Closed on
Nov 30, 2020
Sold by
Catamount Properties 2018 Llc
Bought by
Matlock Jared Bryce and Matlock Tamrisa Mallisa
Current Estimated Value
Home Financials for this Owner
Home Financials are based on the most recent Mortgage that was taken out on this home.
Original Mortgage
$332,500
Outstanding Balance
$293,298
Interest Rate
2.8%
Mortgage Type
New Conventional
Estimated Equity
$259,892
Purchase Details
Closed on
Sep 1, 2020
Sold by
Luckettfields Leslye M
Bought by
Catamount Properties 2018 Llc
Purchase Details
Closed on
Aug 12, 2016
Sold by
Wilson Parker Homes Of Thompso
Bought by
Luckettfields Gregory L and Luckettfields Leslye M
Home Financials for this Owner
Home Financials are based on the most recent Mortgage that was taken out on this home.
Original Mortgage
$305,000
Interest Rate
3.42%
Mortgage Type
VA
Purchase Details
Closed on
Dec 16, 2015
Sold by
Tpb Re Holdings Iii Llc
Bought by
Wilson Parker Homes Of Thompson Crossing
Create a Home Valuation Report for This Property
The Home Valuation Report is an in-depth analysis detailing your home's value as well as a comparison with similar homes in the area
Home Values in the Area
Average Home Value in this Area
Purchase History
| Date | Buyer | Sale Price | Title Company |
|---|---|---|---|
| Matlock Jared Bryce | $350,000 | -- | |
| Catamount Properties 2018 Llc | $303,600 | -- | |
| Luckettfields Gregory L | $305,000 | -- | |
| Wilson Parker Homes Of Thompson Crossing | $189,000 | -- |
Source: Public Records
Mortgage History
| Date | Status | Borrower | Loan Amount |
|---|---|---|---|
| Open | Matlock Jared Bryce | $332,500 | |
| Previous Owner | Luckettfields Gregory L | $305,000 |
Source: Public Records
Tax History Compared to Growth
Tax History
| Year | Tax Paid | Tax Assessment Tax Assessment Total Assessment is a certain percentage of the fair market value that is determined by local assessors to be the total taxable value of land and additions on the property. | Land | Improvement |
|---|---|---|---|---|
| 2025 | $7,119 | $241,120 | $40,000 | $201,120 |
| 2024 | $6,632 | $209,200 | $41,600 | $167,600 |
| 2023 | $6,632 | $209,200 | $41,600 | $167,600 |
| 2022 | $6,324 | $195,680 | $35,200 | $160,480 |
| 2021 | $5,135 | $140,000 | $26,880 | $113,120 |
| 2020 | $2,360 | $146,920 | $26,880 | $120,040 |
| 2019 | $1,896 | $131,320 | $25,360 | $105,960 |
| 2018 | $2,048 | $131,320 | $25,360 | $105,960 |
| 2016 | $751 | $14,000 | $14,000 | $0 |
| 2015 | $527 | $14,000 | $14,000 | $0 |
Source: Public Records
Map
Nearby Homes
- 2307 Loughridge Dr
- 4298 Friar Tuck Ln
- 2740 Blake Towers Ln
- 2910 Blake Towers Ln
- 2930 Blake Towers Ln
- 2678 N Bogan Rd
- 2938 Pebblebrook Dr
- 4375 Easter Lily Ave
- 3026 Sea Aster Way
- 3016 Sea Aster Way
- 4238 Hamilton Mill Rd
- 2997 Spring Lake Dr
- 2997 Springlake Dr
- 4304 Grey Park Dr
- 3340 Ivey Ridge Rd NE
- 3964 Hamilton Mill Rd
- 2446 Thrasher Rd
- 4017 S South Bogan Rd
- 2468 Beauchamp Ct
- 2458 Beauchamp Ct Unit 98
- 2458 Beauchamp Ct
- 2478 Beauchamp Ct Unit 96
- 2478 Beauchamp Ct
- 2447 Loughridge Dr
- 2457 Loughridge Dr Unit 91
- 2448 Beauchamp Ct
- 2448 Beauchamp Ct Unit 99
- 2437 Loughridge Dr
- 2498 Beauchamp Ct Unit 95
- 2498 Beauchamp Ct
- 2923 Beauchamp Ct
- 0 Beauchamp Ct Unit 8615708
- 0 Beauchamp Ct Unit 8596973
- 0 Beauchamp Ct Unit 8187785
- 0 Beauchamp Ct Unit 7627379
- 0 Beauchamp Ct Unit 8661587
- 0 Beauchamp Ct Unit 8617047
- 0 Beauchamp Ct Unit 8955359