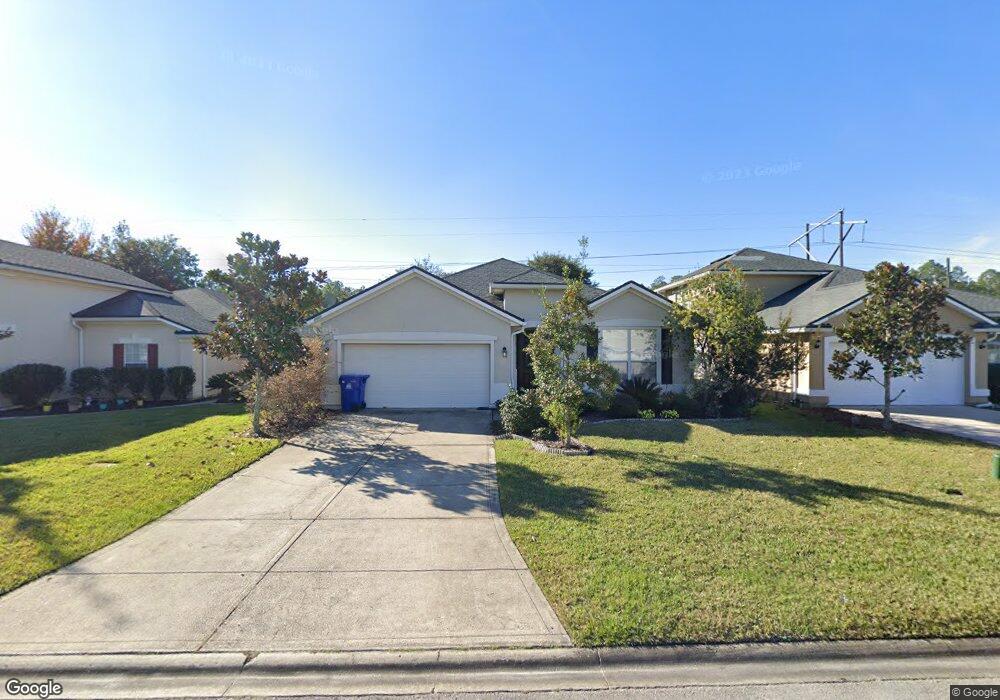
2468 Willowbend Dr Saint Augustine, FL 32092
Estimated Value: $391,000 - $427,000
3
Beds
2
Baths
2,036
Sq Ft
$197/Sq Ft
Est. Value
About This Home
This home is located at 2468 Willowbend Dr, Saint Augustine, FL 32092 and is currently estimated at $401,913, approximately $197 per square foot. 2468 Willowbend Dr is a home located in St. Johns County with nearby schools including Timberlin Creek Elementary School and Switzerland Point Middle School.
Ownership History
Date
Name
Owned For
Owner Type
Purchase Details
Closed on
Jun 26, 2009
Sold by
Us Bank Na
Bought by
Cline Shawn Ian and Cline Tiffany April
Current Estimated Value
Home Financials for this Owner
Home Financials are based on the most recent Mortgage that was taken out on this home.
Original Mortgage
$181,560
Outstanding Balance
$115,881
Interest Rate
4.88%
Mortgage Type
Purchase Money Mortgage
Estimated Equity
$286,032
Purchase Details
Closed on
Apr 6, 2009
Sold by
Hilliard Ryan K and Hilliard Camika H
Bought by
Us Bank Na and Rasc 2006Ks7
Purchase Details
Closed on
Jun 29, 2006
Sold by
Beazer Homes Corp
Bought by
Hilliard Ryan K and Hilliard Camika H
Home Financials for this Owner
Home Financials are based on the most recent Mortgage that was taken out on this home.
Original Mortgage
$205,988
Interest Rate
7.99%
Mortgage Type
Purchase Money Mortgage
Create a Home Valuation Report for This Property
The Home Valuation Report is an in-depth analysis detailing your home's value as well as a comparison with similar homes in the area
Purchase History
| Date | Buyer | Sale Price | Title Company |
|---|---|---|---|
| Cline Shawn Ian | $178,000 | Sunbelt Title Agency | |
| Us Bank Na | $257,100 | Attorney | |
| Hilliard Ryan K | $257,500 | Landamerica Gulfatlantic Tit |
Source: Public Records
Mortgage History
| Date | Status | Borrower | Loan Amount |
|---|---|---|---|
| Open | Cline Shawn Ian | $181,560 | |
| Previous Owner | Hilliard Ryan K | $205,988 |
Source: Public Records
Tax History
| Year | Tax Paid | Tax Assessment Tax Assessment Total Assessment is a certain percentage of the fair market value that is determined by local assessors to be the total taxable value of land and additions on the property. | Land | Improvement |
|---|---|---|---|---|
| 2025 | $4,229 | $357,514 | -- | -- |
| 2024 | $4,229 | $362,609 | $90,000 | $272,609 |
| 2023 | $4,229 | $336,901 | $90,000 | $246,901 |
| 2022 | $4,037 | $334,833 | $78,400 | $256,433 |
| 2021 | $3,468 | $248,491 | $0 | $0 |
| 2020 | $3,186 | $221,987 | $0 | $0 |
| 2019 | $3,137 | $208,260 | $0 | $0 |
| 2018 | $3,078 | $202,194 | $0 | $0 |
| 2017 | $3,015 | $193,995 | $37,500 | $156,495 |
| 2016 | $2,891 | $179,501 | $0 | $0 |
| 2015 | $2,728 | $164,722 | $0 | $0 |
| 2014 | $1,847 | $148,693 | $0 | $0 |
Source: Public Records
Map
Nearby Homes
- 2108 S Cranbrook Ave
- 391 Stonehurst Pkwy
- 1330 Ivyhedge Ave
- 517 Johns Creek Pkwy
- 649 W Johns Creek Pkwy
- 1564 W Windy Willow Dr
- 3521 Indian Creek Blvd
- 2110 Thorn Hollow Ct
- 1268 Stonehedge Trail Ln
- 136 Southern Grove Dr
- 2135 Thorn Hollow Ct
- 229 Carolina Jasmine Ln
- 1884 Cross Pointe Way
- 528 Prosperity Lake Dr
- 257 Carolina Jasmine Ln
- 4476 Comanche Trail Blvd
- 301 Johns Glen Dr
- 1436 Tintern Ln
- 4340 Comanche Trail Blvd
- 200 S Arabella Way
- 2464 Willowbend Dr
- 2472 Willowbend Dr
- 2460 Willowbend Dr
- 2476 Willowbend Dr
- 2456 Willowbend Dr
- 2463 Willowbend Dr
- 2480 Willowbend Dr
- 2467 Willowbend Dr
- 2459 Willowbend Dr
- 2452 Willowbend Dr
- 2455 Willowbend Dr
- 2473 Willowbend Dr
- 2484 Willowbend Dr
- 2451 Willowbend Dr
- 2448 Willowbend Dr
- 2435 Willowbend Dr
- 2483 Willowbend Dr
- 2425 Willowbend Dr
- 2421 Willowbend Dr
- 2444 Willowbend Dr
Your Personal Tour Guide
Ask me questions while you tour the home.