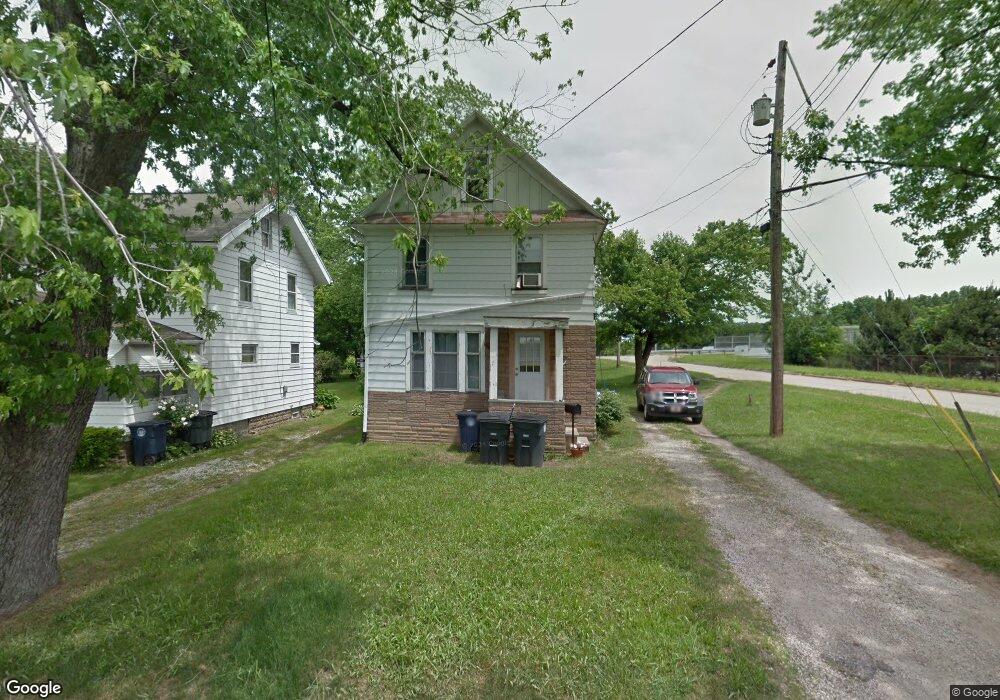
2469 28th St SW Akron, OH 44314
Kenmore NeighborhoodEstimated Value: $84,000 - $124,000
3
Beds
1
Bath
1,258
Sq Ft
$79/Sq Ft
Est. Value
About This Home
This home is located at 2469 28th St SW, Akron, OH 44314 and is currently estimated at $99,545, approximately $79 per square foot. 2469 28th St SW is a home located in Summit County with nearby schools including Imagine Akron Academy, Emmanuel Christian Academy, and Sam Salem Community Learning Center.
Ownership History
Date
Name
Owned For
Owner Type
Purchase Details
Closed on
Jun 3, 2025
Sold by
Karam Andrew
Bought by
Karam Construction Llc
Current Estimated Value
Purchase Details
Closed on
Feb 4, 2020
Sold by
Karam Heather and Brunson Heather
Bought by
Karam Andrew
Purchase Details
Closed on
Mar 15, 2006
Sold by
Fannie Mae
Bought by
Karam Heather
Home Financials for this Owner
Home Financials are based on the most recent Mortgage that was taken out on this home.
Original Mortgage
$31,800
Interest Rate
6.33%
Mortgage Type
Fannie Mae Freddie Mac
Purchase Details
Closed on
Nov 5, 2004
Sold by
Scott Albina Whisman and Scott Charles R
Bought by
Federal National Mortgage Association
Purchase Details
Closed on
Jul 17, 2000
Sold by
Rager Homer D
Bought by
Whisman Albina C
Home Financials for this Owner
Home Financials are based on the most recent Mortgage that was taken out on this home.
Original Mortgage
$66,500
Interest Rate
8.31%
Create a Home Valuation Report for This Property
The Home Valuation Report is an in-depth analysis detailing your home's value as well as a comparison with similar homes in the area
Home Values in the Area
Average Home Value in this Area
Purchase History
| Date | Buyer | Sale Price | Title Company |
|---|---|---|---|
| Karam Construction Llc | -- | None Listed On Document | |
| Karam Andrew | -- | None Available | |
| Karam Heather | $31,800 | Beacon Title Agency Inc | |
| Federal National Mortgage Association | -- | -- | |
| Whisman Albina C | $66,500 | Quality Title Agency Inc |
Source: Public Records
Mortgage History
| Date | Status | Borrower | Loan Amount |
|---|---|---|---|
| Previous Owner | Karam Heather | $31,800 | |
| Previous Owner | Whisman Albina C | $66,500 |
Source: Public Records
Tax History Compared to Growth
Tax History
| Year | Tax Paid | Tax Assessment Tax Assessment Total Assessment is a certain percentage of the fair market value that is determined by local assessors to be the total taxable value of land and additions on the property. | Land | Improvement |
|---|---|---|---|---|
| 2025 | $1,658 | $18,883 | $5,495 | $13,388 |
| 2024 | $1,159 | $18,883 | $5,495 | $13,388 |
| 2023 | $1,658 | $18,883 | $5,495 | $13,388 |
| 2022 | $909 | $11,109 | $3,234 | $7,875 |
| 2021 | $909 | $11,109 | $3,234 | $7,875 |
| 2020 | $878 | $11,110 | $3,230 | $7,880 |
| 2019 | $815 | $9,210 | $3,600 | $5,610 |
| 2018 | $806 | $9,210 | $3,600 | $5,610 |
| 2017 | $1,249 | $9,210 | $3,600 | $5,610 |
| 2016 | $1,069 | $12,770 | $4,830 | $7,940 |
| 2015 | $1,249 | $15,320 | $4,830 | $10,490 |
| 2014 | $1,240 | $15,320 | $4,830 | $10,490 |
| 2013 | $1,304 | $15,390 | $4,830 | $10,560 |
Source: Public Records
Map
Nearby Homes
- 1178 Welsh Ave
- 1237 Mcintosh Ave
- 1241 Mcintosh Ave
- 2387 29th St SW Unit 2389
- 2518 30th St SW
- 1174 Kohler Ave
- 1266 Kohler Ave
- 1295 Kohler Ave
- 1392 Belcher Ave
- 1288 Tampa Ave
- 1107 W Wilbeth Rd
- 2301 East Ave
- 1218 Weiser Ave
- 2278 26th St SW
- 2354 21st St SW
- 2320 22nd St SW
- 1197 Carey Ave
- 172 & 173 Belcher Ave
- 1178 Florida Ave
- 1223 Florida Ave
- 2465 28th St SW
- 2461 28th St SW
- 2474 28th St SW
- 1214 Welsh Ave
- 2466 26th St SW
- 2462 26th St SW
- 1218 Welsh Ave
- 1198 Welsh Ave
- 1230 Welsh Ave
- 1196 Welsh Ave
- 2470 26th St SW
- 1472 Kenmore Blvd
- 2518 27th St SW
- 1234 Welsh Ave
- 1192 Welsh Ave
- 2517 27th St SW
- 1182 Welsh Ave
- 1492 Kenmore Blvd
- 1246 Welsh Ave
- 2523 27th St SW