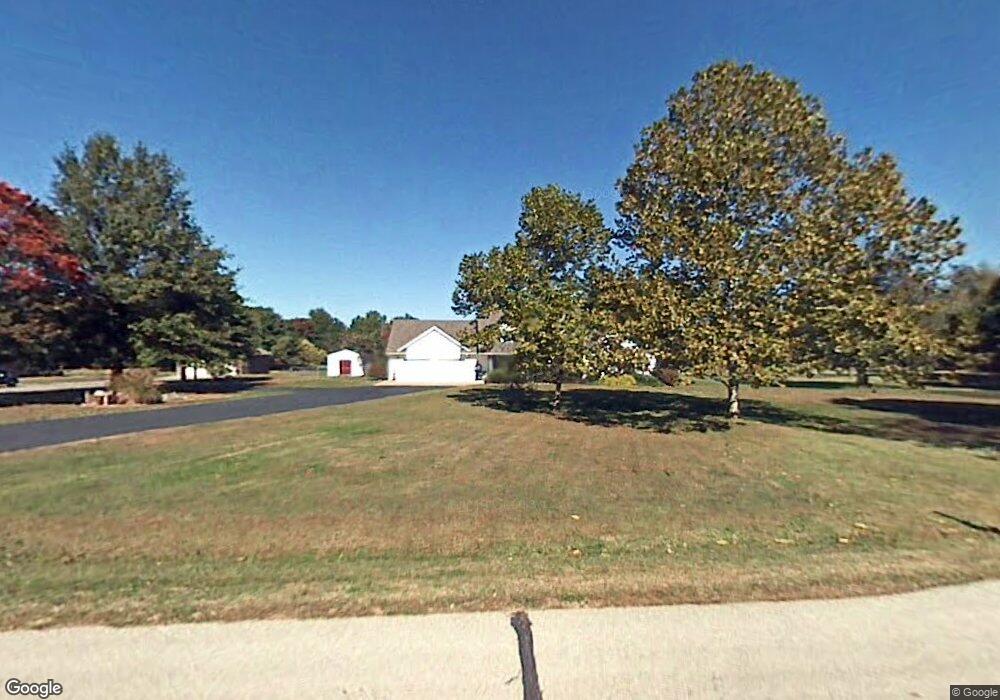
2469 W Whitten Rd Carthage, MO 64836
Estimated Value: $400,000 - $467,000
3
Beds
4
Baths
2,660
Sq Ft
$159/Sq Ft
Est. Value
About This Home
This home is located at 2469 W Whitten Rd, Carthage, MO 64836 and is currently estimated at $423,912, approximately $159 per square foot. 2469 W Whitten Rd is a home located in Jasper County with nearby schools including Carthage High School, Victory Academy, and St. Ann's Catholic School.
Ownership History
Date
Name
Owned For
Owner Type
Purchase Details
Closed on
Apr 4, 2024
Sold by
Parker Boaz and Parker Sumhr D
Bought by
Parker Boaz and Parker Sumhr D
Current Estimated Value
Purchase Details
Closed on
Sep 20, 2013
Sold by
White Suzanne and White Timothy
Bought by
Parker Boaz and Parker Sumhr D
Home Financials for this Owner
Home Financials are based on the most recent Mortgage that was taken out on this home.
Original Mortgage
$177,650
Interest Rate
4.46%
Mortgage Type
New Conventional
Purchase Details
Closed on
Aug 26, 2010
Sold by
Hobart Aaron L and Hobart Connie L
Bought by
White Suzanne and Denney Matt
Create a Home Valuation Report for This Property
The Home Valuation Report is an in-depth analysis detailing your home's value as well as a comparison with similar homes in the area
Home Values in the Area
Average Home Value in this Area
Purchase History
| Date | Buyer | Sale Price | Title Company |
|---|---|---|---|
| Parker Boaz | -- | None Listed On Document | |
| Parker Boaz | -- | Fatco | |
| White Suzanne | $145,000 | None Available |
Source: Public Records
Mortgage History
| Date | Status | Borrower | Loan Amount |
|---|---|---|---|
| Previous Owner | Parker Boaz | $177,650 |
Source: Public Records
Tax History Compared to Growth
Tax History
| Year | Tax Paid | Tax Assessment Tax Assessment Total Assessment is a certain percentage of the fair market value that is determined by local assessors to be the total taxable value of land and additions on the property. | Land | Improvement |
|---|---|---|---|---|
| 2024 | $2,222 | $47,490 | $8,280 | $39,210 |
| 2023 | $2,222 | $47,490 | $8,280 | $39,210 |
| 2022 | $2,196 | $47,110 | $8,280 | $38,830 |
| 2021 | $2,170 | $47,110 | $8,280 | $38,830 |
| 2020 | $2,111 | $44,050 | $8,280 | $35,770 |
| 2019 | $2,116 | $44,050 | $8,280 | $35,770 |
| 2018 | $2,123 | $44,250 | $0 | $0 |
| 2017 | $2,129 | $44,250 | $0 | $0 |
| 2016 | $2,108 | $43,960 | $0 | $0 |
| 2015 | $1,932 | $43,960 | $0 | $0 |
| 2014 | $1,932 | $43,960 | $0 | $0 |
Source: Public Records
Map
Nearby Homes
- 16537 Isis Rd
- 16549 Inca Rd
- 902 S Quail Run
- 1019 Hawthorne St
- Tbd S Country Club Rd
- 2012 Beau Dr
- 1253 Wilson Rd
- 1516 Alexandra Dr
- 2000 Amber Ln
- Lot 3 2nd Addition (Piper Dr) Unit 3
- Lot 3 2nd Addition (Piper)
- 1615 W Budlong St
- 2038 W Trolley Car Ln
- 1641 Alexandra Dr
- 1704 Liam St
- 1324 Olive St
- 1300 S Baker Blvd
- 000 County Lane 175
- 17546 State Highway 96
- 1240 Harrington Ave
- 2475 W Whitten Rd
- 2413 W Whitten Rd
- 2438 W Sequoia Ln
- 2426 W Sequoia Ln
- 2464 W Whitten Rd
- 2438 W Whitten Rd
- 2478 W Whitten Rd
- 2385 W Whitten Rd
- 2416 W Whitten Rd
- 845 S Rocky Rd
- 2439 W Sequoia Ln
- 2421 W Sequoia Ln
- 2392 W Whitten Rd
- 876 S Rocky Rd
- 8277 County Road 164
- 2389 W Sequoia Ln
- 835 S Rocky Rd
- 2356 W Whitten Rd
- 2433 Idlewood Ln
- 16483 Isis Rd