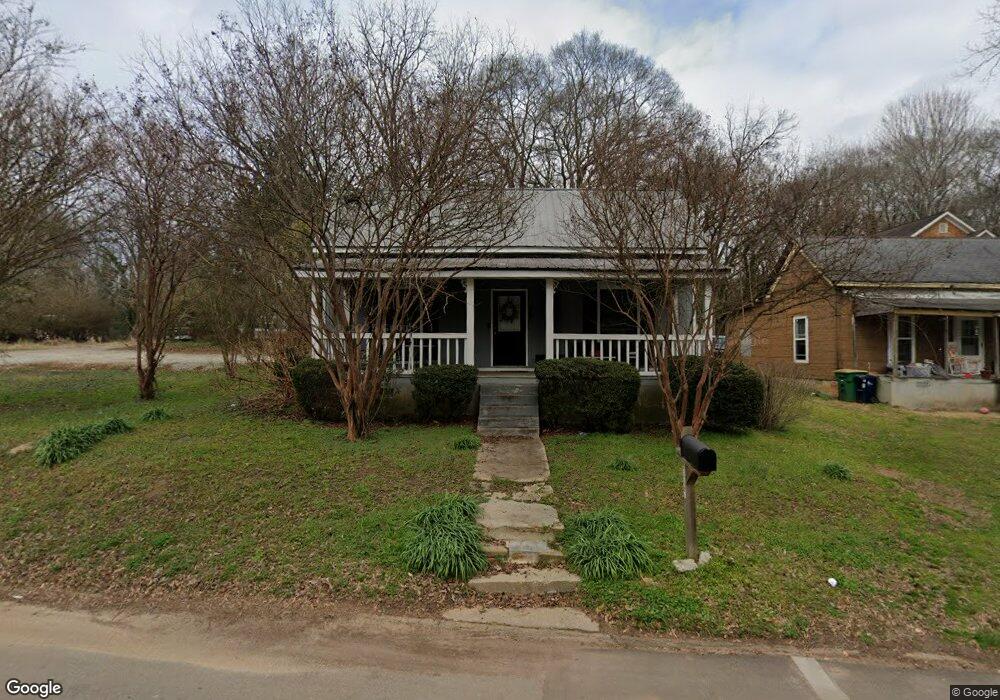
247 Arch St Athens, GA 30601
Chicopee-Dudley NeighborhoodEstimated Value: $180,000 - $287,849
2
Beds
1
Bath
984
Sq Ft
$239/Sq Ft
Est. Value
About This Home
This home is located at 247 Arch St, Athens, GA 30601 and is currently estimated at $235,212, approximately $239 per square foot. 247 Arch St is a home located in Clarke County with nearby schools including Gaines Elementary School, Hilsman Middle School, and Cedar Shoals High School.
Ownership History
Date
Name
Owned For
Owner Type
Purchase Details
Closed on
Aug 28, 2019
Sold by
Purcell Holly
Bought by
Pitner Thomas David and Pitner Lora Christian
Current Estimated Value
Home Financials for this Owner
Home Financials are based on the most recent Mortgage that was taken out on this home.
Original Mortgage
$101,600
Outstanding Balance
$88,790
Interest Rate
3.7%
Mortgage Type
New Conventional
Estimated Equity
$146,422
Purchase Details
Closed on
Jun 5, 2019
Sold by
Weems Louise
Bought by
Purcell Holly
Purchase Details
Closed on
May 30, 2008
Sold by
J W York Properties Llc
Bought by
Mcarthur Alan
Purchase Details
Closed on
May 31, 1991
Sold by
Scott Robert and Hazel Scott Pinckney
Bought by
Weems Louise
Purchase Details
Closed on
Apr 16, 1991
Sold by
Williams Jessie Mae By Exec
Bought by
Scott Robert and Hazel Scott Pinck
Create a Home Valuation Report for This Property
The Home Valuation Report is an in-depth analysis detailing your home's value as well as a comparison with similar homes in the area
Home Values in the Area
Average Home Value in this Area
Purchase History
| Date | Buyer | Sale Price | Title Company |
|---|---|---|---|
| Pitner Thomas David | $127,000 | -- | |
| Purcell Holly | $60,000 | -- | |
| Mcarthur Alan | -- | -- | |
| Mcarthur Alan | $174,900 | -- | |
| Weems Louise | $10,000 | -- | |
| Scott Robert | -- | -- |
Source: Public Records
Mortgage History
| Date | Status | Borrower | Loan Amount |
|---|---|---|---|
| Open | Pitner Thomas David | $101,600 |
Source: Public Records
Tax History Compared to Growth
Tax History
| Year | Tax Paid | Tax Assessment Tax Assessment Total Assessment is a certain percentage of the fair market value that is determined by local assessors to be the total taxable value of land and additions on the property. | Land | Improvement |
|---|---|---|---|---|
| 2025 | $3,129 | $100,773 | $24,000 | $76,773 |
| 2024 | $3,129 | $94,434 | $24,000 | $70,434 |
| 2023 | $2,951 | $81,928 | $18,000 | $63,928 |
| 2022 | $2,111 | $66,172 | $16,000 | $50,172 |
| 2021 | $1,864 | $55,300 | $14,720 | $40,580 |
| 2020 | $1,712 | $51,253 | $14,720 | $36,533 |
| 2019 | $888 | $26,153 | $14,131 | $12,022 |
| 2018 | $856 | $25,228 | $14,131 | $11,097 |
| 2017 | $857 | $25,244 | $14,131 | $11,113 |
| 2016 | $978 | $28,814 | $20,534 | $8,280 |
| 2015 | $980 | $28,814 | $20,534 | $8,280 |
| 2014 | $981 | $28,814 | $20,534 | $8,280 |
Source: Public Records
Map
Nearby Homes