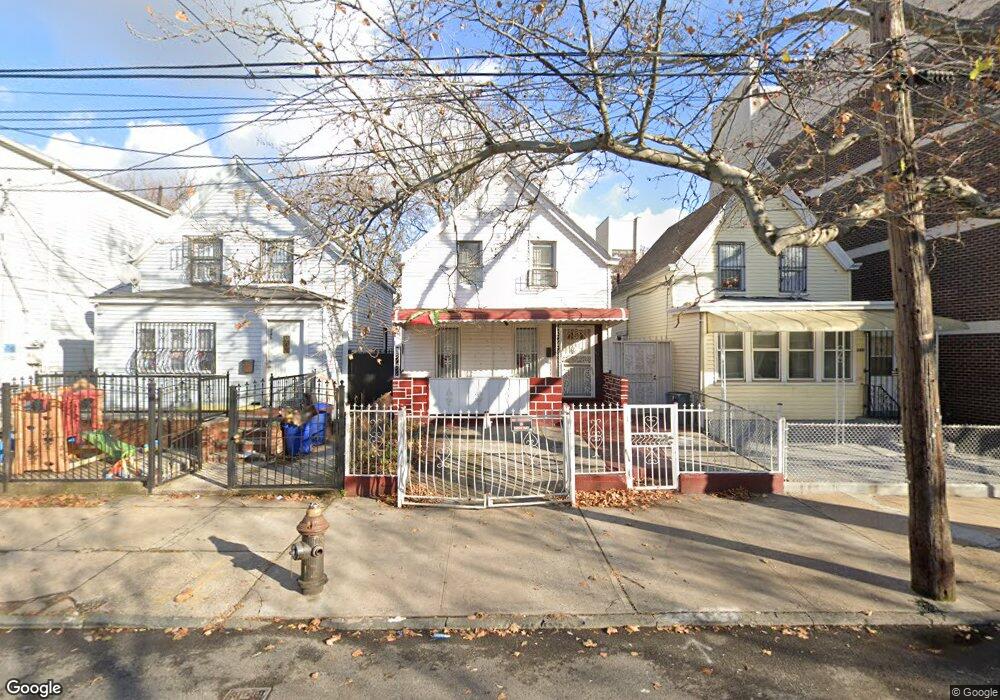
247 Bradford St Brooklyn, NY 11207
East New York NeighborhoodEstimated Value: $682,000 - $849,000
--
Bed
--
Bath
1,854
Sq Ft
$409/Sq Ft
Est. Value
About This Home
This home is located at 247 Bradford St, Brooklyn, NY 11207 and is currently estimated at $758,758, approximately $409 per square foot. 247 Bradford St is a home located in Kings County with nearby schools including P.S. 149 Danny Kaye, J.H.S 292 Margaret S. Douglas, and Salve Regina Catholic Academy.
Ownership History
Date
Name
Owned For
Owner Type
Purchase Details
Closed on
Jul 12, 2023
Sold by
Daly Frederick V
Bought by
Daly Crystal and Daly Frederick V
Current Estimated Value
Purchase Details
Closed on
Dec 23, 1996
Sold by
Job Kitty Ann Rebecca
Bought by
Daly Frederick V
Purchase Details
Closed on
Aug 5, 1994
Sold by
Machutta Edna and Kalsow Elizabeth
Bought by
Job Kitty Ann
Home Financials for this Owner
Home Financials are based on the most recent Mortgage that was taken out on this home.
Original Mortgage
$38,000
Interest Rate
8.65%
Mortgage Type
Purchase Money Mortgage
Purchase Details
Closed on
Jul 28, 1994
Sold by
Zelany Doris and Schroeder Albert
Bought by
Job Kitty Ann
Home Financials for this Owner
Home Financials are based on the most recent Mortgage that was taken out on this home.
Original Mortgage
$38,000
Interest Rate
8.65%
Mortgage Type
Purchase Money Mortgage
Create a Home Valuation Report for This Property
The Home Valuation Report is an in-depth analysis detailing your home's value as well as a comparison with similar homes in the area
Home Values in the Area
Average Home Value in this Area
Purchase History
| Date | Buyer | Sale Price | Title Company |
|---|---|---|---|
| Daly Crystal | -- | -- | |
| Daly Frederick V | -- | -- | |
| Job Kitty Ann | -- | -- | |
| Job Kitty Ann | -- | -- | |
| Job Kitty Ann | -- | -- |
Source: Public Records
Mortgage History
| Date | Status | Borrower | Loan Amount |
|---|---|---|---|
| Previous Owner | Job Kitty Ann | $38,000 |
Source: Public Records
Tax History Compared to Growth
Tax History
| Year | Tax Paid | Tax Assessment Tax Assessment Total Assessment is a certain percentage of the fair market value that is determined by local assessors to be the total taxable value of land and additions on the property. | Land | Improvement |
|---|---|---|---|---|
| 2025 | $1,819 | $61,620 | $11,640 | $49,980 |
| 2024 | $1,819 | $55,500 | $11,640 | $43,860 |
| 2023 | $1,723 | $59,580 | $11,640 | $47,940 |
| 2022 | $1,579 | $49,440 | $11,640 | $37,800 |
| 2021 | $1,566 | $43,080 | $11,640 | $31,440 |
| 2020 | $1,174 | $36,000 | $11,640 | $24,360 |
| 2019 | $1,530 | $39,780 | $11,640 | $28,140 |
| 2018 | $1,382 | $8,238 | $3,489 | $4,749 |
| 2017 | $1,288 | $7,790 | $3,514 | $4,276 |
| 2016 | $1,164 | $7,372 | $3,446 | $3,926 |
| 2015 | $886 | $7,363 | $3,004 | $4,359 |
| 2014 | $886 | $7,262 | $2,519 | $4,743 |
Source: Public Records
Map
Nearby Homes
- 243 Wyona St
- 2210 Pitkin Ave
- 207 Bradford St
- 279 van Siclen Ave
- 459 Belmont Ave
- 346 van Siclen Ave
- 412 Hendrix St
- 572 Glenmore Ave
- 303 Hendrix St
- 159 Wyona St
- 576 Glenmore Ave
- 358 van Siclen Ave
- 174 van Siclen Ave
- 563 Belmont Ave
- 342 Wyona St
- 34&36 Marginal St
- 396 Barbey St
- 2825 Atlantic Ave
- 443 Miller Ave
- 202 Schenck Ave
- 249 Bradford St
- 245 Bradford St
- 243 Bradford St
- 241 Bradford St
- 316 Miller Ave
- 312 Miller Ave
- 310 Miller Ave
- 306 Miller Ave
- 488 Glenmore Ave
- 492 Glenmore Ave
- 486 Glenmore Ave
- 496 Glenmore Ave
- 502 Glenmore Ave
- 250 Bradford St
- 252 Bradford St
- 484 Glenmore Ave
- 246 Bradford St
- 256 Bradford St
- 504 Glenmore Ave
- 240 Bradford St