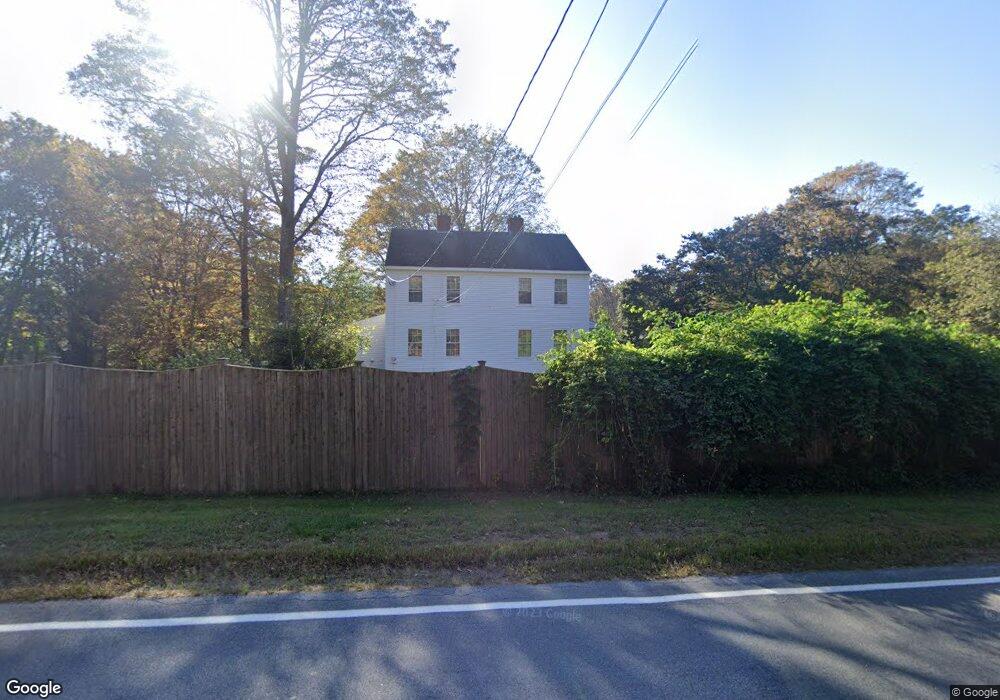
247 Central St Georgetown, MA 01833
Estimated Value: $977,000 - $1,117,000
4
Beds
2
Baths
3,542
Sq Ft
$291/Sq Ft
Est. Value
About This Home
This home is located at 247 Central St, Georgetown, MA 01833 and is currently estimated at $1,030,585, approximately $290 per square foot. 247 Central St is a home located in Essex County with nearby schools including Perley Elementary School, Penn Brook School, and Georgetown High School.
Ownership History
Date
Name
Owned For
Owner Type
Purchase Details
Closed on
Sep 15, 2000
Sold by
Wheeler Derek J and Wheeler Julia B
Bought by
Claydon Rt and Gleason-Claydon Patr
Current Estimated Value
Purchase Details
Closed on
Oct 1, 1996
Sold by
Mikonis Jacqueline M and Jordan Carolyn Jm
Bought by
Wheeler Derek J and Wheeler Julia B
Purchase Details
Closed on
Jun 30, 1989
Sold by
Maclennan Mark
Bought by
Mikonis Jacqueline
Create a Home Valuation Report for This Property
The Home Valuation Report is an in-depth analysis detailing your home's value as well as a comparison with similar homes in the area
Home Values in the Area
Average Home Value in this Area
Purchase History
| Date | Buyer | Sale Price | Title Company |
|---|---|---|---|
| Claydon Rt | $442,500 | -- | |
| Wheeler Derek J | $300,000 | -- | |
| Mikonis Jacqueline | $285,000 | -- |
Source: Public Records
Mortgage History
| Date | Status | Borrower | Loan Amount |
|---|---|---|---|
| Open | Mikonis Jacqueline | $140,000 | |
| Closed | Mikonis Jacqueline | $100,000 | |
| Previous Owner | Mikonis Jacqueline | $180,000 |
Source: Public Records
Tax History
| Year | Tax Paid | Tax Assessment Tax Assessment Total Assessment is a certain percentage of the fair market value that is determined by local assessors to be the total taxable value of land and additions on the property. | Land | Improvement |
|---|---|---|---|---|
| 2025 | $9,847 | $890,300 | $285,900 | $604,400 |
| 2024 | $8,978 | $715,400 | $199,100 | $516,300 |
| 2023 | $9,195 | $708,400 | $199,100 | $509,300 |
| 2022 | $9,022 | $640,800 | $173,900 | $466,900 |
| 2021 | $8,779 | $552,500 | $173,900 | $378,600 |
| 2020 | $8,796 | $552,500 | $173,900 | $378,600 |
| 2019 | $8,668 | $549,300 | $170,700 | $378,600 |
| 2018 | $8,723 | $549,300 | $170,700 | $378,600 |
| 2017 | $8,389 | $517,500 | $170,700 | $346,800 |
| 2016 | $8,100 | $510,400 | $170,700 | $339,700 |
| 2015 | $7,922 | $494,200 | $170,700 | $323,500 |
| 2014 | $7,115 | $506,400 | $170,700 | $335,700 |
Source: Public Records
Map
Nearby Homes
- 107 King George Dr Unit 9
- 11 Central St
- 53 Woodcrest Rd
- 32 Summer St
- 8 Molloy Rd
- 534 Ipswich Rd
- 24 Appleton Ln
- 206 W Main St Unit 5
- 206 W Main St Unit 4
- 206 W Main St Unit 2
- 206 W Main St Unit 3
- 231 W Main St
- 870 Haverhill St Unit 2B
- 98 West St
- 427b Ipswich Rd
- Lot B Willow Ave
- 10 Ashcroft Cir
- 17 Ice Pond Dr
- 12 Warren St
- 30 Christa Dr
Your Personal Tour Guide
Ask me questions while you tour the home.