247 Chamberlin Rd Myrtle Beach, SC 29588
Burgess NeighborhoodEstimated Value: $776,000 - $812,000
4
Beds
5
Baths
4,200
Sq Ft
$188/Sq Ft
Est. Value
About This Home
This home is located at 247 Chamberlin Rd, Myrtle Beach, SC 29588 and is currently estimated at $788,603, approximately $187 per square foot. 247 Chamberlin Rd is a home located in Horry County with nearby schools including St. James Elementary School, St. James Middle School, and St. James Intermediate.
Ownership History
Date
Name
Owned For
Owner Type
Purchase Details
Closed on
Oct 31, 2019
Sold by
Downey Lawrence M
Bought by
Downey Lawrence M and Downey Darlene Ann
Current Estimated Value
Home Financials for this Owner
Home Financials are based on the most recent Mortgage that was taken out on this home.
Original Mortgage
$323,000
Outstanding Balance
$282,435
Interest Rate
3.65%
Estimated Equity
$506,168
Purchase Details
Closed on
Sep 8, 2008
Sold by
Downey Lawrence M
Bought by
Downey Lawrence M
Purchase Details
Closed on
Dec 15, 2005
Sold by
P & M 10300 Manchaca Ltd
Bought by
Downey Lawrence M and Downey Charlotte I
Purchase Details
Closed on
Dec 2, 2004
Sold by
Enterprise Road Development Llc
Bought by
P & M 10300 Manchaca Ltd
Home Financials for this Owner
Home Financials are based on the most recent Mortgage that was taken out on this home.
Original Mortgage
$67,900
Interest Rate
5.67%
Mortgage Type
Purchase Money Mortgage
Create a Home Valuation Report for This Property
The Home Valuation Report is an in-depth analysis detailing your home's value as well as a comparison with similar homes in the area
Home Values in the Area
Average Home Value in this Area
Purchase History
| Date | Buyer | Sale Price | Title Company |
|---|---|---|---|
| Downey Lawrence M | -- | -- | |
| Downey Lawrence M | -- | -- | |
| Downey Lawrence M | $177,900 | -- | |
| P & M 10300 Manchaca Ltd | $67,900 | -- |
Source: Public Records
Mortgage History
| Date | Status | Borrower | Loan Amount |
|---|---|---|---|
| Open | Downey Lawrence M | $323,000 | |
| Previous Owner | P & M 10300 Manchaca Ltd | $67,900 |
Source: Public Records
Tax History Compared to Growth
Tax History
| Year | Tax Paid | Tax Assessment Tax Assessment Total Assessment is a certain percentage of the fair market value that is determined by local assessors to be the total taxable value of land and additions on the property. | Land | Improvement |
|---|---|---|---|---|
| 2024 | $1,845 | $28,703 | $6,480 | $22,223 |
| 2023 | $1,706 | $17,481 | $2,569 | $14,912 |
| 2021 | $1,648 | $21,508 | $2,836 | $18,672 |
| 2020 | $1,478 | $21,508 | $2,836 | $18,672 |
| 2019 | $1,391 | $21,508 | $2,836 | $18,672 |
| 2018 | $1,227 | $15,200 | $2,232 | $12,968 |
| 2017 | $1,212 | $15,200 | $2,232 | $12,968 |
| 2016 | -- | $15,200 | $2,232 | $12,968 |
| 2015 | $1,236 | $15,201 | $2,233 | $12,968 |
| 2014 | $1,141 | $15,201 | $2,233 | $12,968 |
Source: Public Records
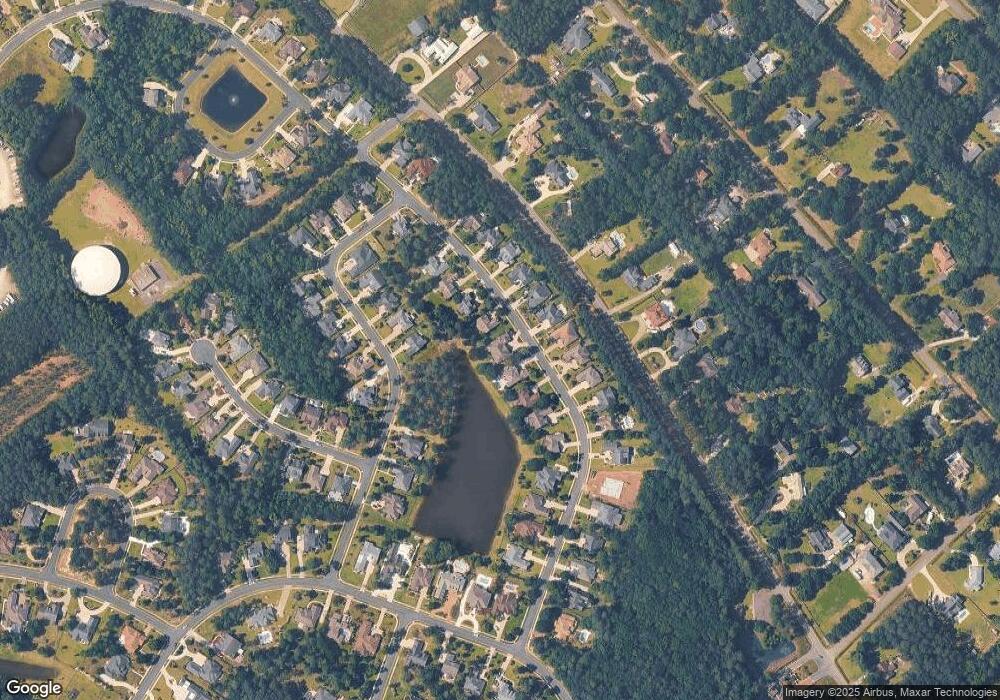
Map
Nearby Homes
- 236 Chamberlin Rd
- 720 Mcduffie Dr
- 269 Chamberlin Rd Unit 269 Chamberlin Road
- 800 Jeter Ln Unit Lot 23 Cypress River
- 757 Mcduffie Dr
- 745 Mcduffie Dr
- 204 Chamberlin Rd
- 840 Jeter Ln
- 396 Wingspan Ct
- 394 Wingspan Ct
- 390 Wingspan Ct
- 378 Wingspan Ct
- 387 Wingspan Ct
- 701 Plumage Ct
- 742 Plumage Ct
- 638 Riverward Dr
- 727 Plumage Ct
- 739 Plumage Ct
- 152 Rose Water Loop
- 8008 McSweeney Ct
- 243 Chamberlin Rd
- 253 Chamberlin Rd
- 253 Chamberlin Rd Unit Lot 464
- 253 Chamberlin Rd Unit CYPRESS RIVER PLANTA
- Lot 6 Chamberlin
- Lot 6 Chamberlin Unit MYRTLE BEACH
- 239 Chamberlin Rd
- 257 Chamberlin Rd
- 257 Chamberlin Rd
- 255 Chamberlin Rd
- 237 Chamberlin Rd
- 248 Chamberlin Rd
- 248 Chamberlin Rd Unit Lot 538
- 252 Chamberlin Rd Unit Cypress River Planta
- 252 Chamberlin Rd Unit Cypress River Planta
- 252 Chamberlin Rd
- 244 Chamberlin Rd
- 724 Mcduffie Dr
- 235 Chamberlin Rd
- 261 Chamberlin Rd Unit Cypress River Planta